

A Complete Design within MASS
A design is complete when all design steps have been performed. Upon the completion of a design, whether it is successful or not, users have access to several output tabs. MASS™ is exceptionally transparent. Users have the opportunity to quickly see exactly what equations the program used to achieve a particular design. This is extremely beneficial not only to users but to other designers that may review users’ work. The program provides detailed drawings that reflect the completed design. The program also provides tabulated results, which typically correspond to each design step. All drawings and results can be readily printed.
Drawings
There are several useful drawings that the program produces, including:
- P-M Diagram (out-of-plane walls and shear walls only)
- Assemblage
- Loads
- Reactions
- Moment
- Shear
Deflection (beams and out-of-plane walls only)
The first drawing becomes available as soon as the assemblage configuration design step is complete. The loads, reactions, moment and shear drawings are available once the loads input design step is performed. However, the final drawings are not displayed until all the design steps have been performed. To view the drawings:
- Click on the tab of the drawing required. For example, for the drawings pertaining to a beam, click on Beam, Loads, Reactions, Moment, Shear, or Deflection.
To zoom into a drawing:
- Select the drawing tab to be viewed. For example, for the drawings pertaining to a beam, click on Beam, Loads, Reactions, Moment, Shear, or Deflection.
- Click on the
 icon in the toolbar to zoom out or the
  icon in the toolbar to zoom in. It is also possible to specify the exact percentage to zoom out (down to 25%) or in by (up to 500%), by typing the value into the ‘Zoom’ textbox.
Note also, that the margins and windows within the program are adjustable (refer to the Windows and Margins section).
For beams, drawings are displayed in the bottom left corner. For out-of-plane walls and shear walls, drawings are displayed in the right window. Users are permitted to select the amount of detail displayed in the drawing. With the Layers drop-down box (shown in Figure 2‑18) users can choose to include or exclude several drawing layers. This feature is available for all drawings in the beam module; however, the specific layers available may vary.
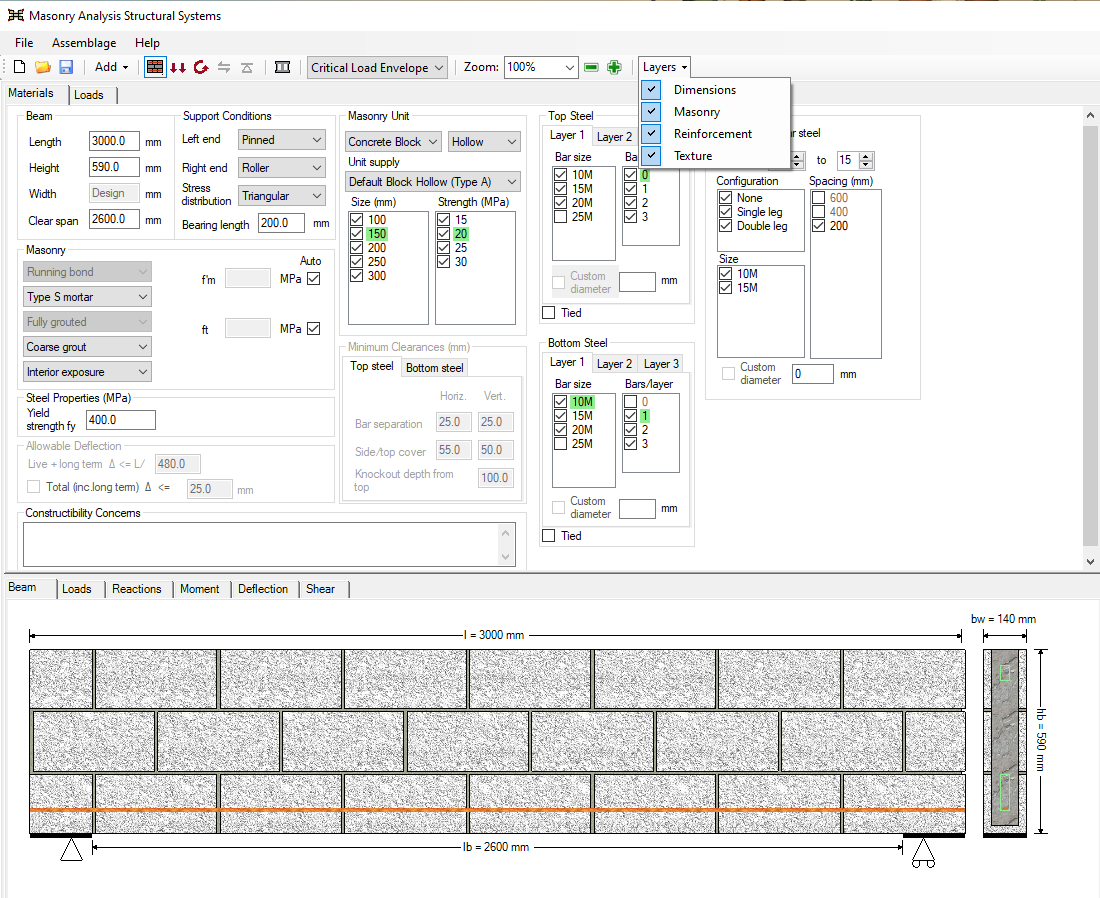
Figure 2‑18: Customizing Drawings Using the Layers Drop-Down Box
Assemblage
The assemblage drawing displays a drawing of the assemblage based on the material properties selected by users. The drawing displays the dimensions of the assemblage, as well as the detailed layout of the bricks or blocks used in the design. Assemblages that require cut units are outlined in red, as shown in Figure 2‑19.

Figure 2‑19: Assemblage Drawing: Cut Units, Reinforcing Steel Placement
The assemblage drawing is updated at each design step to reflect any changes made to the assemblage. Upon the completion of the moment and deflection design for instance, the assemblage displays the steel that has been placed along the length of the assemblage (also shown in Figure 2‑19). In the case of beams and shear walls, a cross-sectional drawing along the width of the assemblage is also drawn, and includes the placement of reinforcing steel. The beam assemblage drawings also contain an additional feature; the cross-sectional view contains green placement boxes, which indicate where in the beam assemblage reinforcement bars can be placed based on minimum clearance requirements.
For more information on the assemblage drawings, refer to Beams, Out-of-Plane Walls, and Shear Walls sections of this user manual.
Loads
The loads drawing displays the loads that are applied to the assemblage. It is completed during the loads input design step. The drawing does not change during any remaining design steps.
A specific applied load can be viewed under the Loads tab by clicking on the box of a particular load under the ‘Selected Load’ column. Multiple loads can be viewed by holding down the Shift key, and selecting the loads to display. The applied loads that are selected are highlighted in blue. Each load type applied is displayed using a different colour. For example, the dead load is displayed in red, and the live load is displayed in green.
Reactions
The reactions drawing displays the support reactions that are applied to the assemblage. It is completed during the loads input design step. The drawing is updated at each design step to reflect any changes made to the assemblage. A change in the masonry unit size for instance, affects the self-weight of the beam, and thus the resulting support reactions.
Reactions due to specific load combinations can be viewed by clicking on the Critical Load Envelope drop-down box, as shown in Figure 2‑20. The drawing indicates at the top left corner the load combination used to determine that specific reaction.
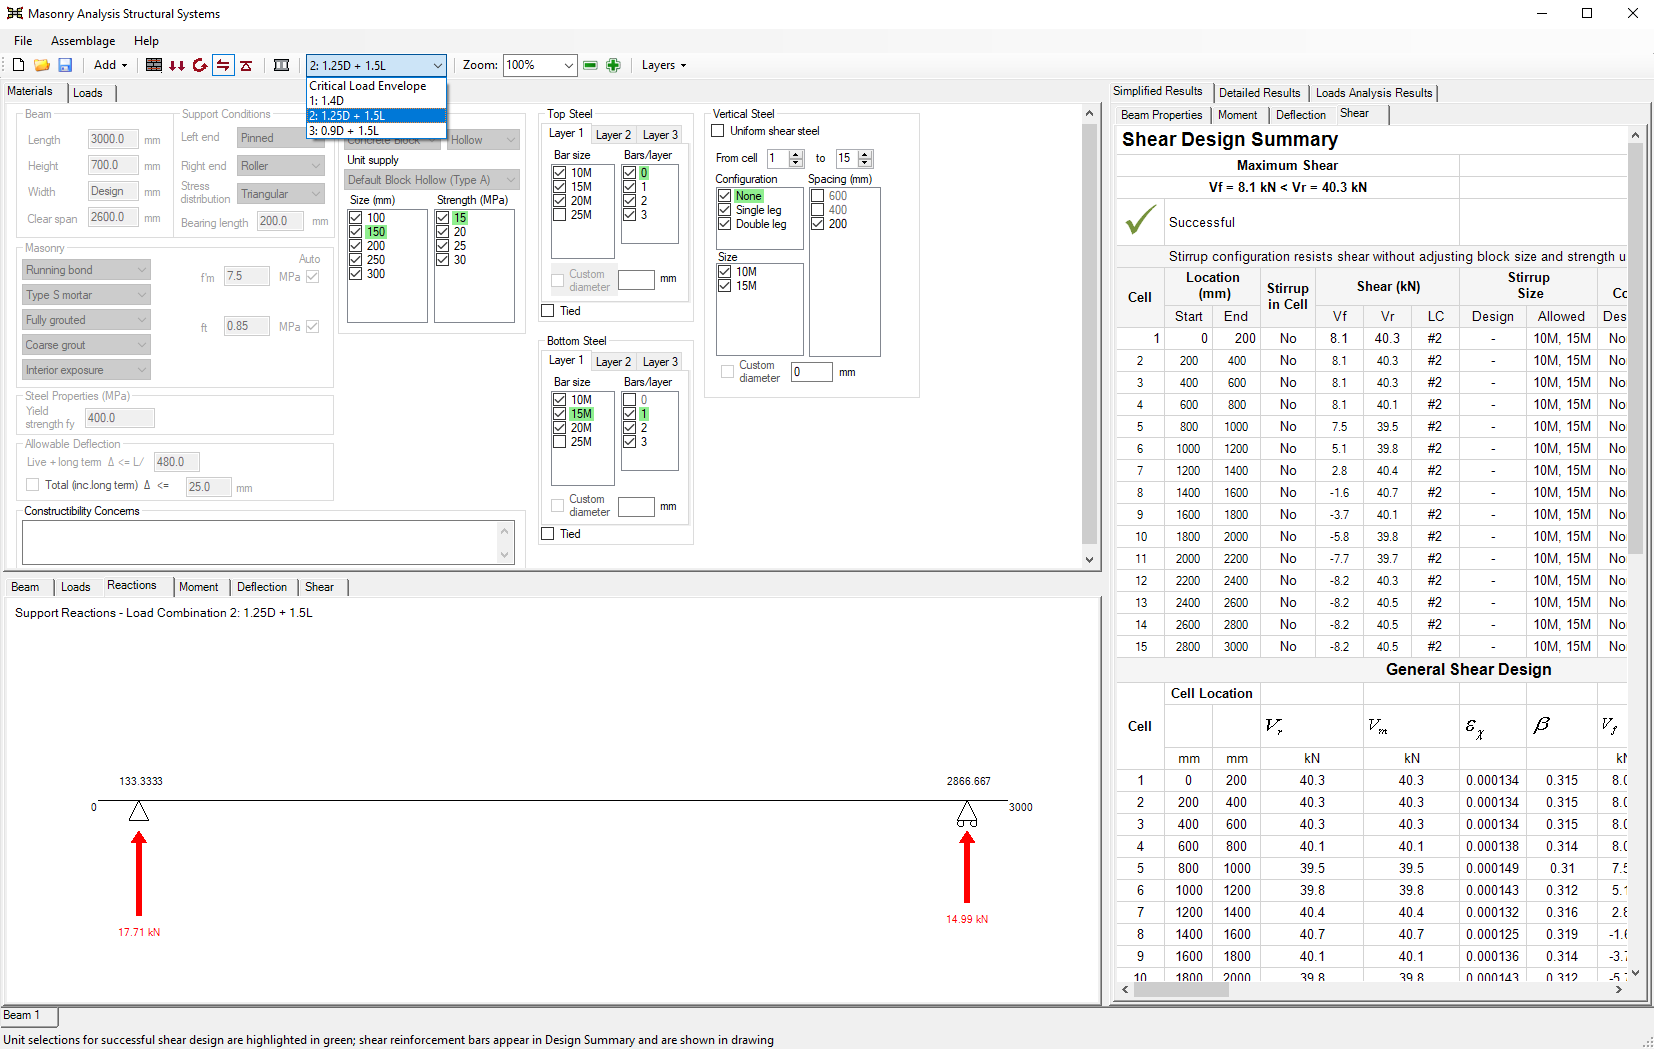
Figure 2‑20: Reactions Drawing
Moment
The moment drawing displays the moment along the assemblage. It is completed during the loads input design step. The drawing is updated at each design step to reflect any changes made to the assemblage. A change in the masonry unit size for instance, affects the self-weight of the beam, the resulting support reactions, and thus the applied moment.
A moment corresponding to a specific load combination can be viewed by clicking on the Critical Load Envelope drop-down box, as shown in Figure 2‑21. The drawing indicates at the top left corner the load combination used to determine that specific moment diagram.
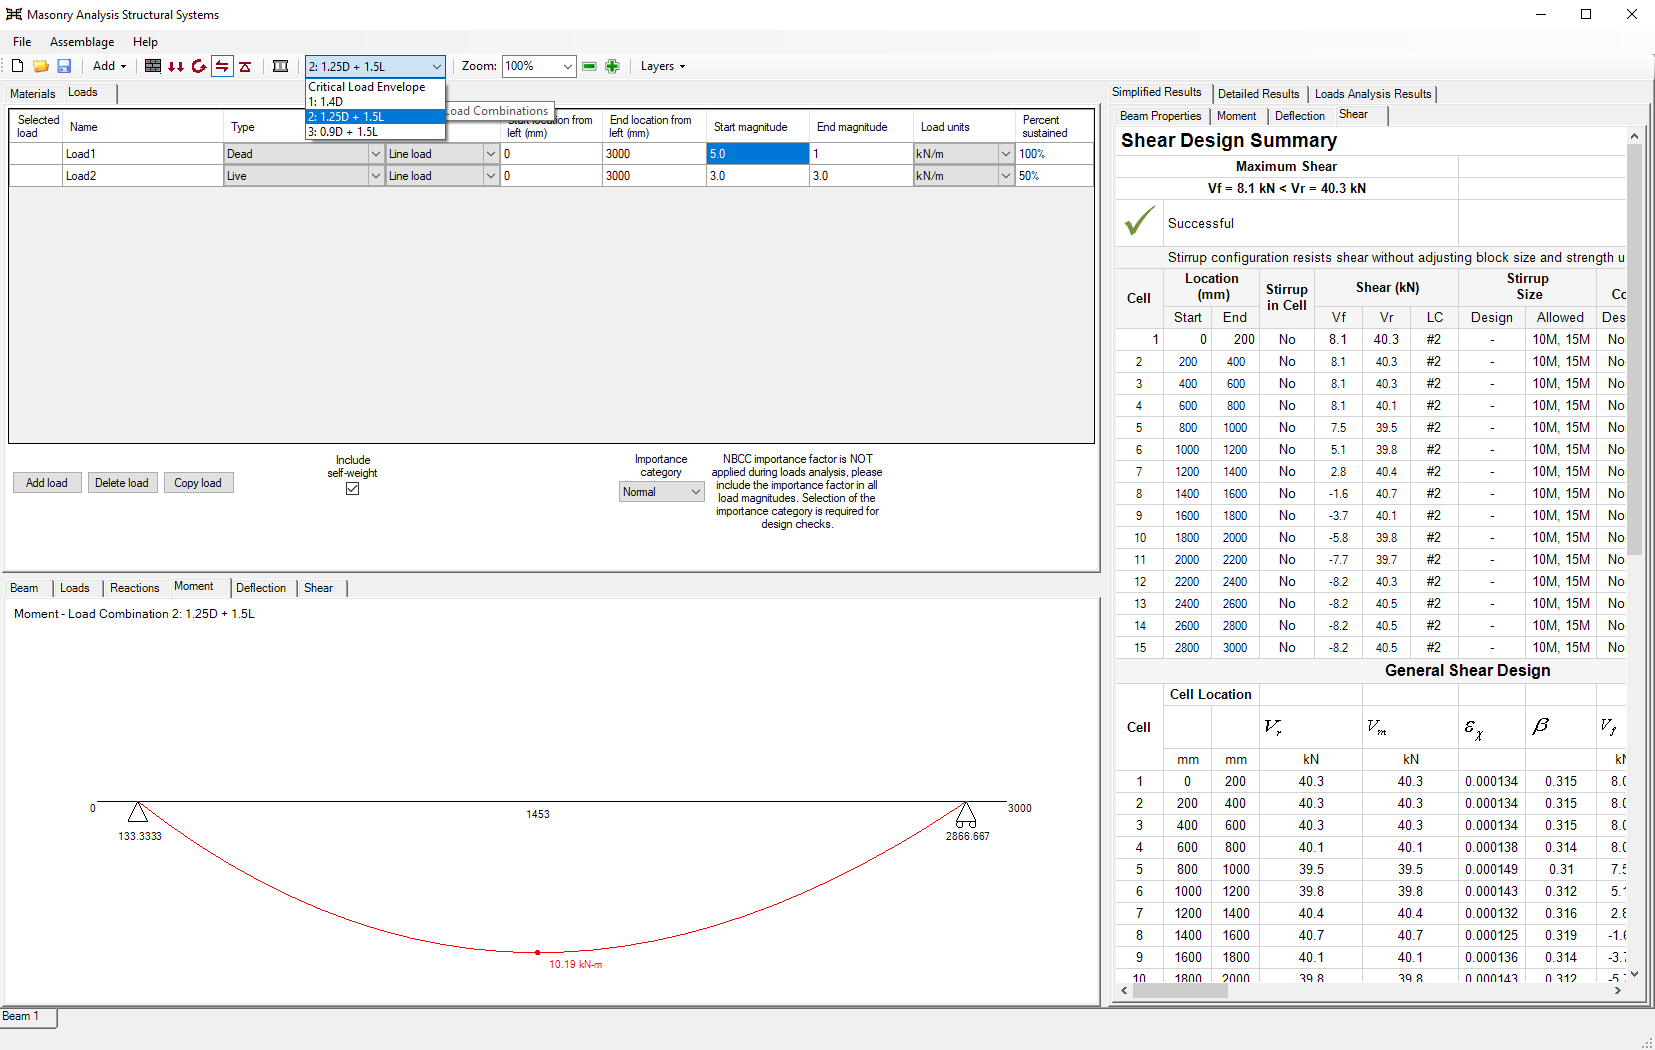
For the critical load envelope selection only, moment diagrams are displayed using red, green, or both. A red moment curve indicates a positive moment. A green moment curve indicates a negative moment.
Deflection
The deflection drawing displays the long term, immediate, and total deflection of the assemblage as well as the deflection limit (as specified by the user). The deflection drawing is not displayed until the moment and deflection design step is performed. The deflection drawing is updated at each design step to reflect any changes made to the assemblage. A change in the masonry unit size for instance, affects the self-weight of the beam, the resulting support reactions, and thus the deflection of the assemblage.
The deflection curves corresponding to a specific load combination can be viewed by clicking on the Critical Load Envelope drop-down box. Figure 2‑22 is drawn using the critical load envelope. The drawing indicates at the top left corner the load combination used to determine that specific deflection diagram.
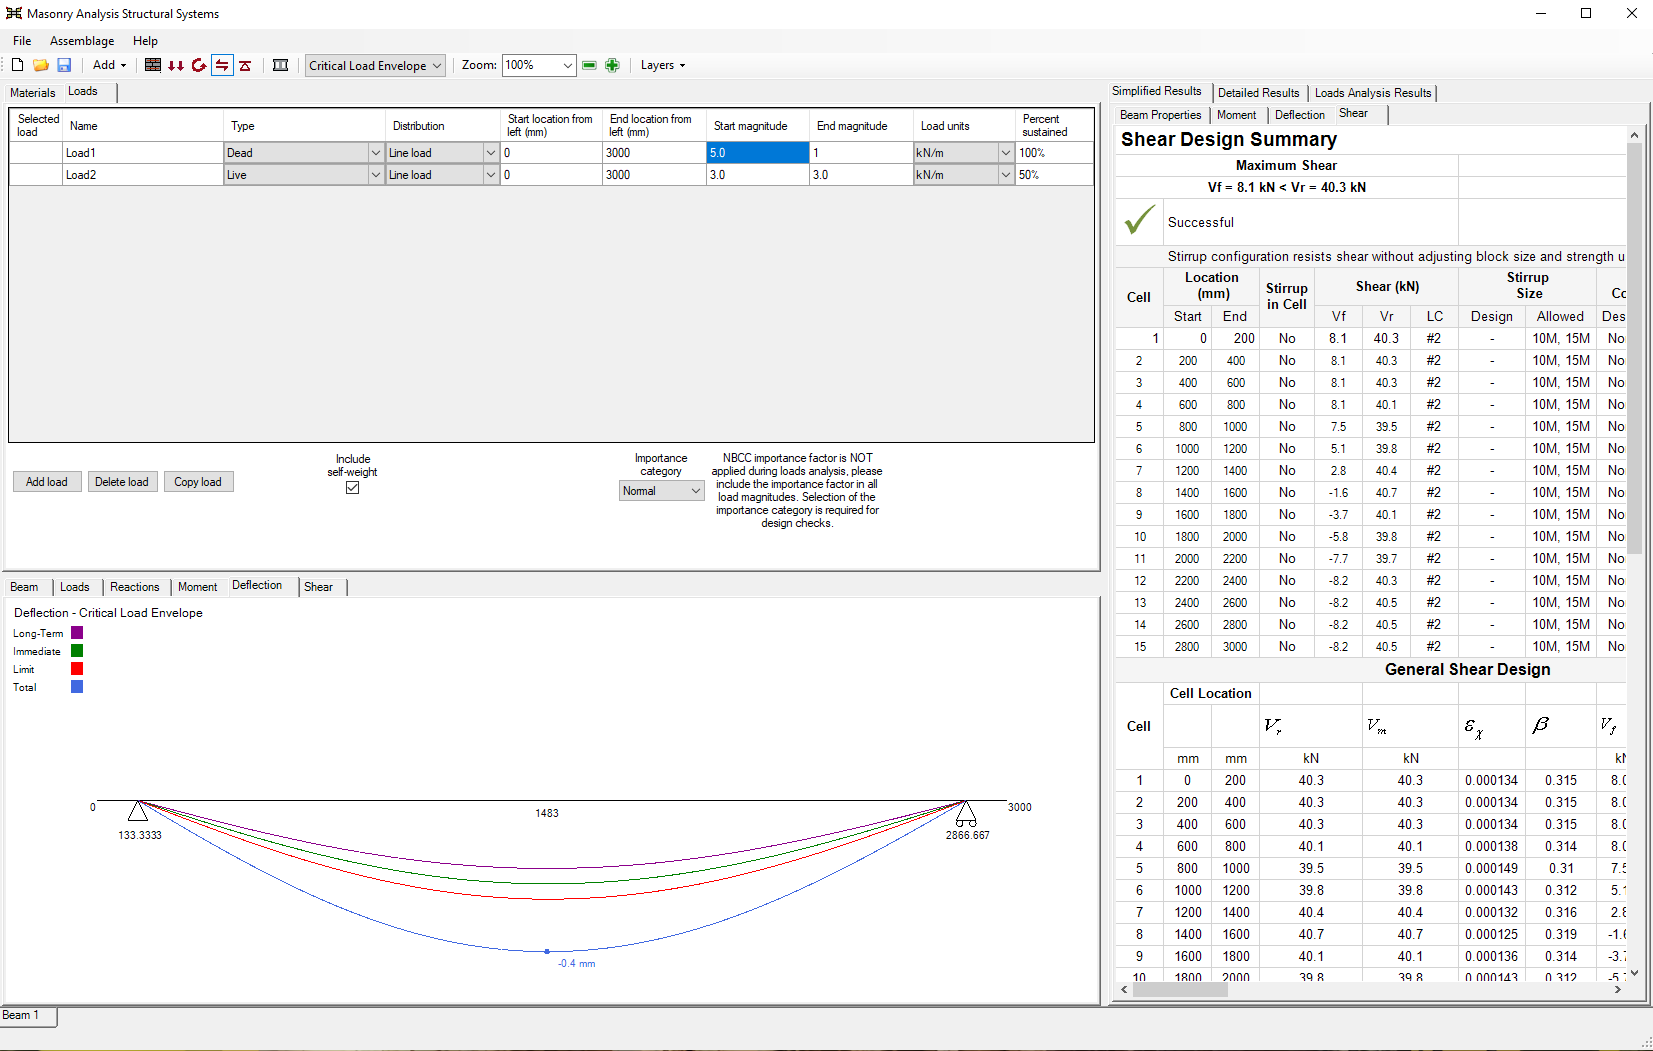
Figure 2‑22: Deflection Drawing (Displayed After Moment Design Step)
Shear
The shear drawing displays the shear applied along the assemblage. It is initially displayed during the loads input design step.
A shear corresponding to a specific load combination can be viewed by clicking on the Critical Load Envelope drop-down box, as shown in Figure 2‑23. The drawing indicates at the top right corner the load combination used to determine that specific shear diagram.
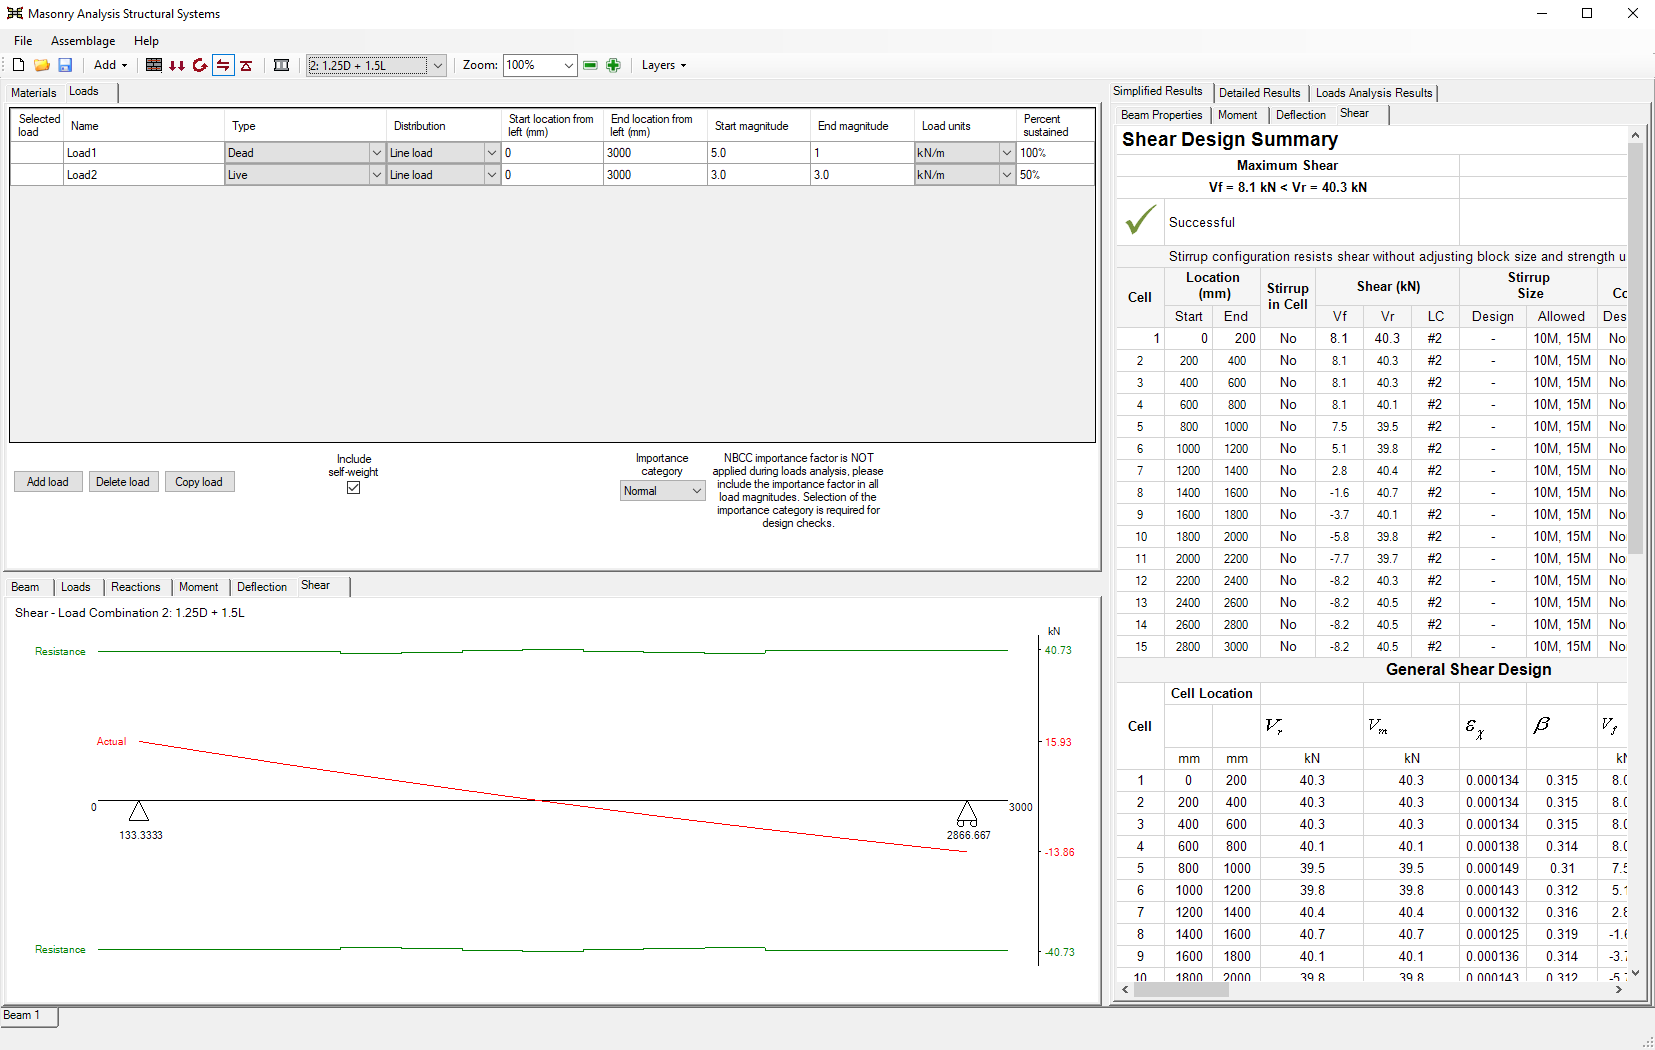
Figure 2‑23: Shear Drawing Prior to the Shear Design Step
The shear drawing is updated at each design step to reflect any changes made to the assemblage. A change in the masonry unit size for instance, affects the self-weight of the beam, the resulting support reactions, and thus the applied shear. Completing the shear design step also changes the shear drawing. In addition the actual (applied) shear displayed at the loads input design stage, the design shear and shear resistance curves are also displayed, as shown in Figure 2‑24. This drawing is available only for the critical load combination since this is the load combination the design shear and shear resistance are determined for.
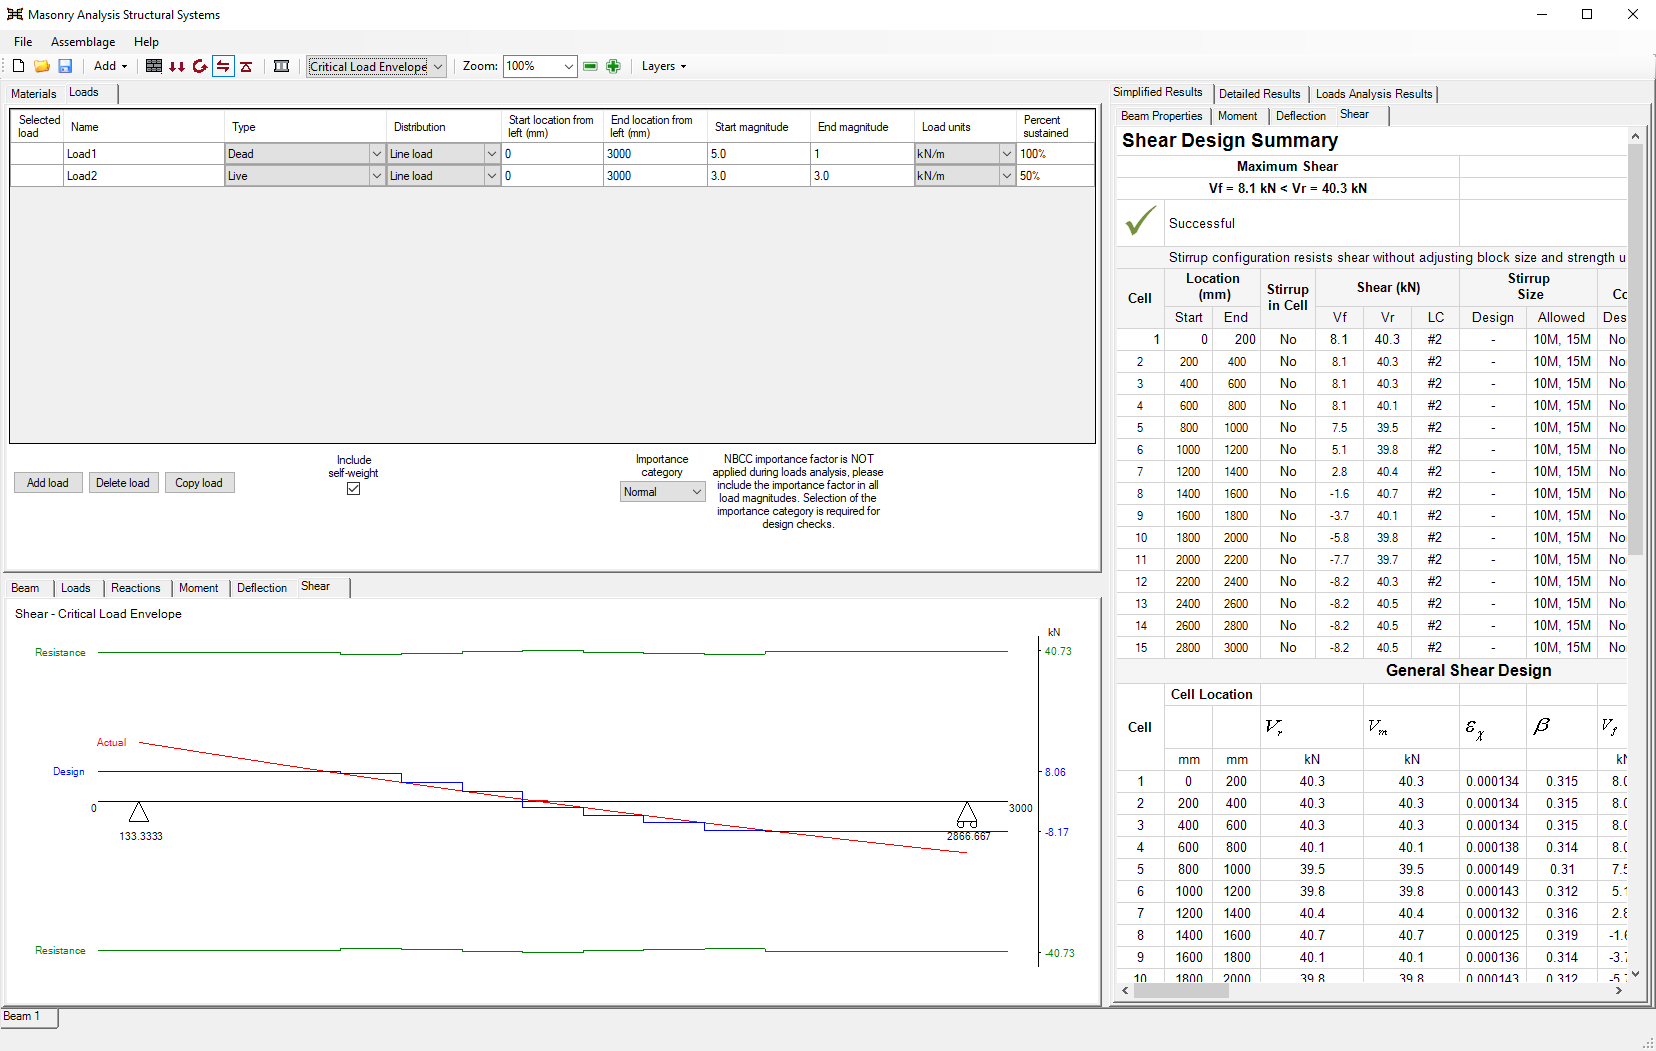
Figure 2‑24: Shear Drawing After the Shear Design Step
Tabulated Results
There are three result categories available for each module: simplified results, detailed results, and loads analysis results. The three result categories vary in the amount of detail provided, but all contain separate tables that approximately correspond to each design step, as shown in Figure 2‑25.
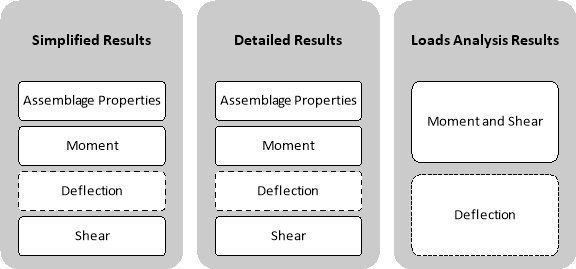
Figure 2‑25: Tabulated Results Categories: Simplified, Detailed, Loads Analysis
To view the tabulated results:
- Click on the tab of the result type to be viewed: Simplified Results, Detailed Results, or Loads Analysis Results.
- Click on the tab of the specific design step. For example, for the simplified results of a beam, it is possible to choose from Beam Properties, Moment, Deflection, or Shear
Simplified Results
The Simplified Results tabs display only those values that are required to give an overview of the results for a design criterion. The Simplified Results tab contains four tabs which provide design summaries for the assemblage properties, moment design, deflection design, shear design. The assemblage properties tab contains a summary table, titled ‘Design Summary Results’, which quickly advises users of the design stages that have been satisfied. Design stages that are successful are indicated with a green check mark, as shown in Figure 2‑26.
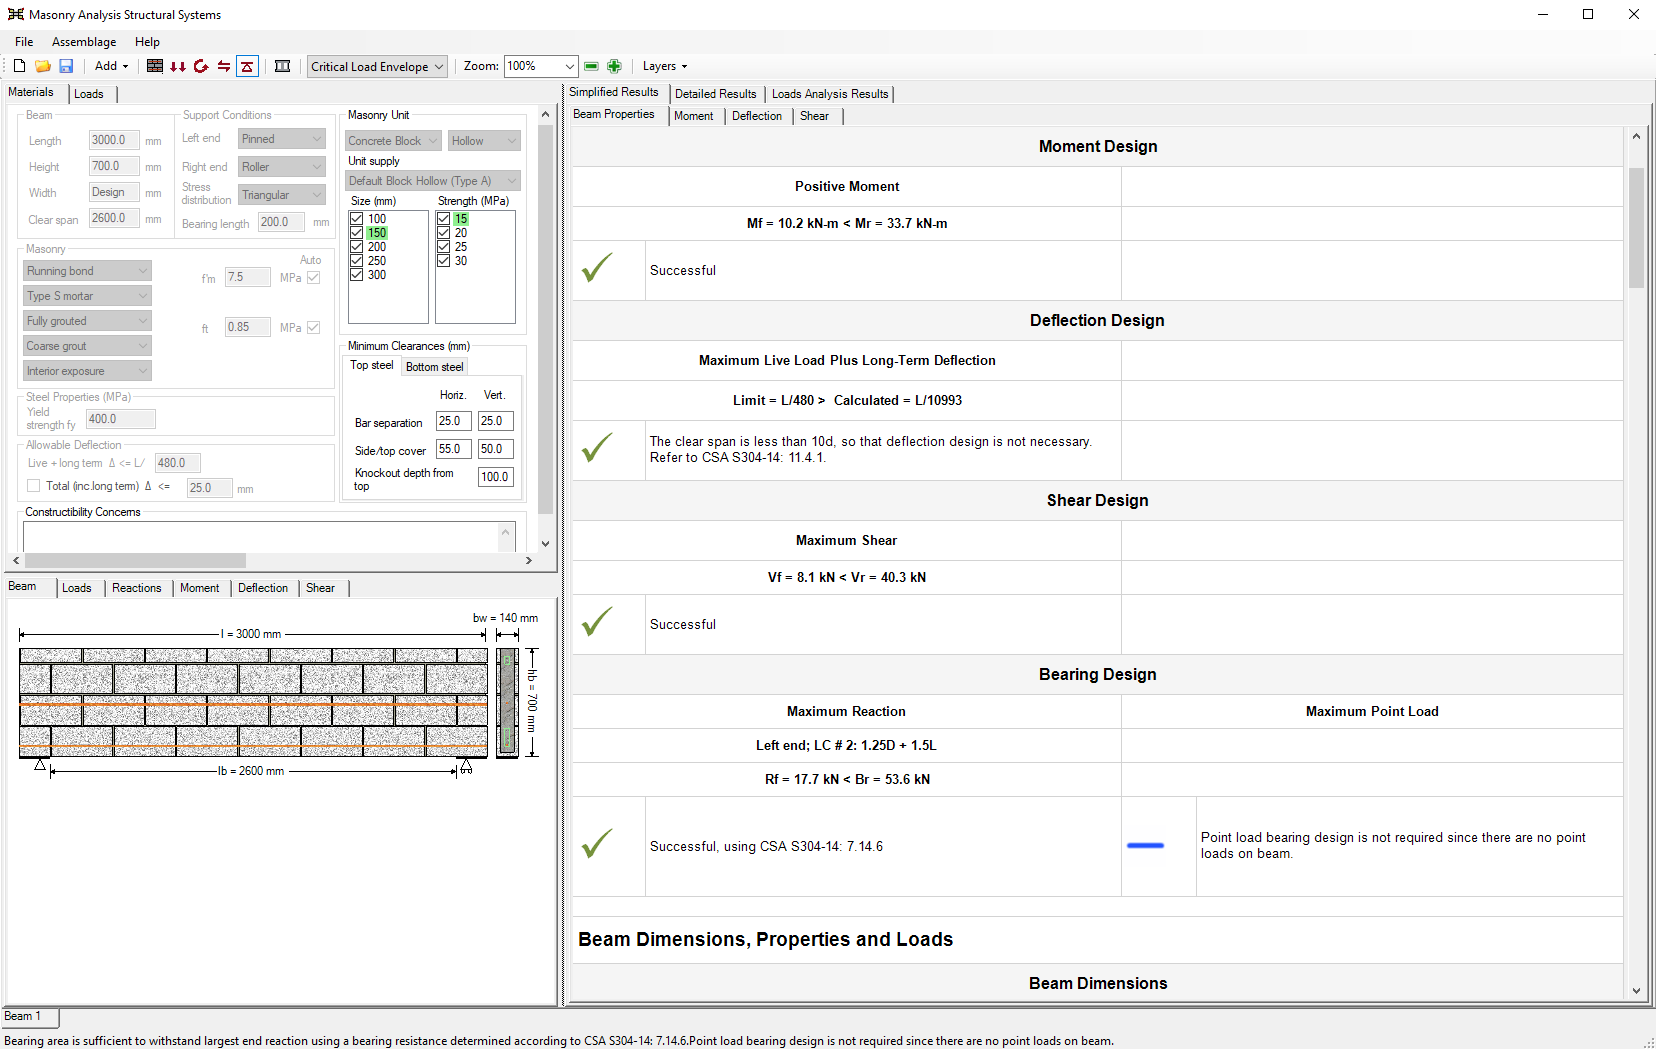
Figure 2‑26: Simplified Results (Beam Properties)
The assemblage properties tab also contains a summary of the material properties that were used in the design. In general, the data presented in this tab is common to more than one design step.
The Moment tab contains a summary table, titled ‘Moment Design Summary’, that quickly advises users if the moment and deflection design step has been satisfied. The summary page also includes data generated in the moment design stage.
The Simplified Results tab contains similar tabs for the deflection design, and shear design. For more information on using the simplified results, refer to Beams, Out-of-Plane Walls, and Shear Walls sections of this user manual.
Detailed Results
The Detailed Results tabs provide the intermediate calculations at each design step. The detailed results are organized into a table that includes:
- Variables used in the design
- Calculated values (of the successful design run or the last unsuccessful design run)
- Units employed
- Engineering equations (or descriptions of the origin of the values in the absence of equations)
- CSA standard reference (where applicable).
The Detailed Results tab contains four tabs which provide data for the assemblage properties, moment design, deflection design, and shear design. The assemblage properties tab contains a table that provides information about the assemblage geometry, the reinforcement, and the constants and factors. In general, the data presented in this tab is common to more than one design step. A sample detailed results table is shown in Figure 2‑27.
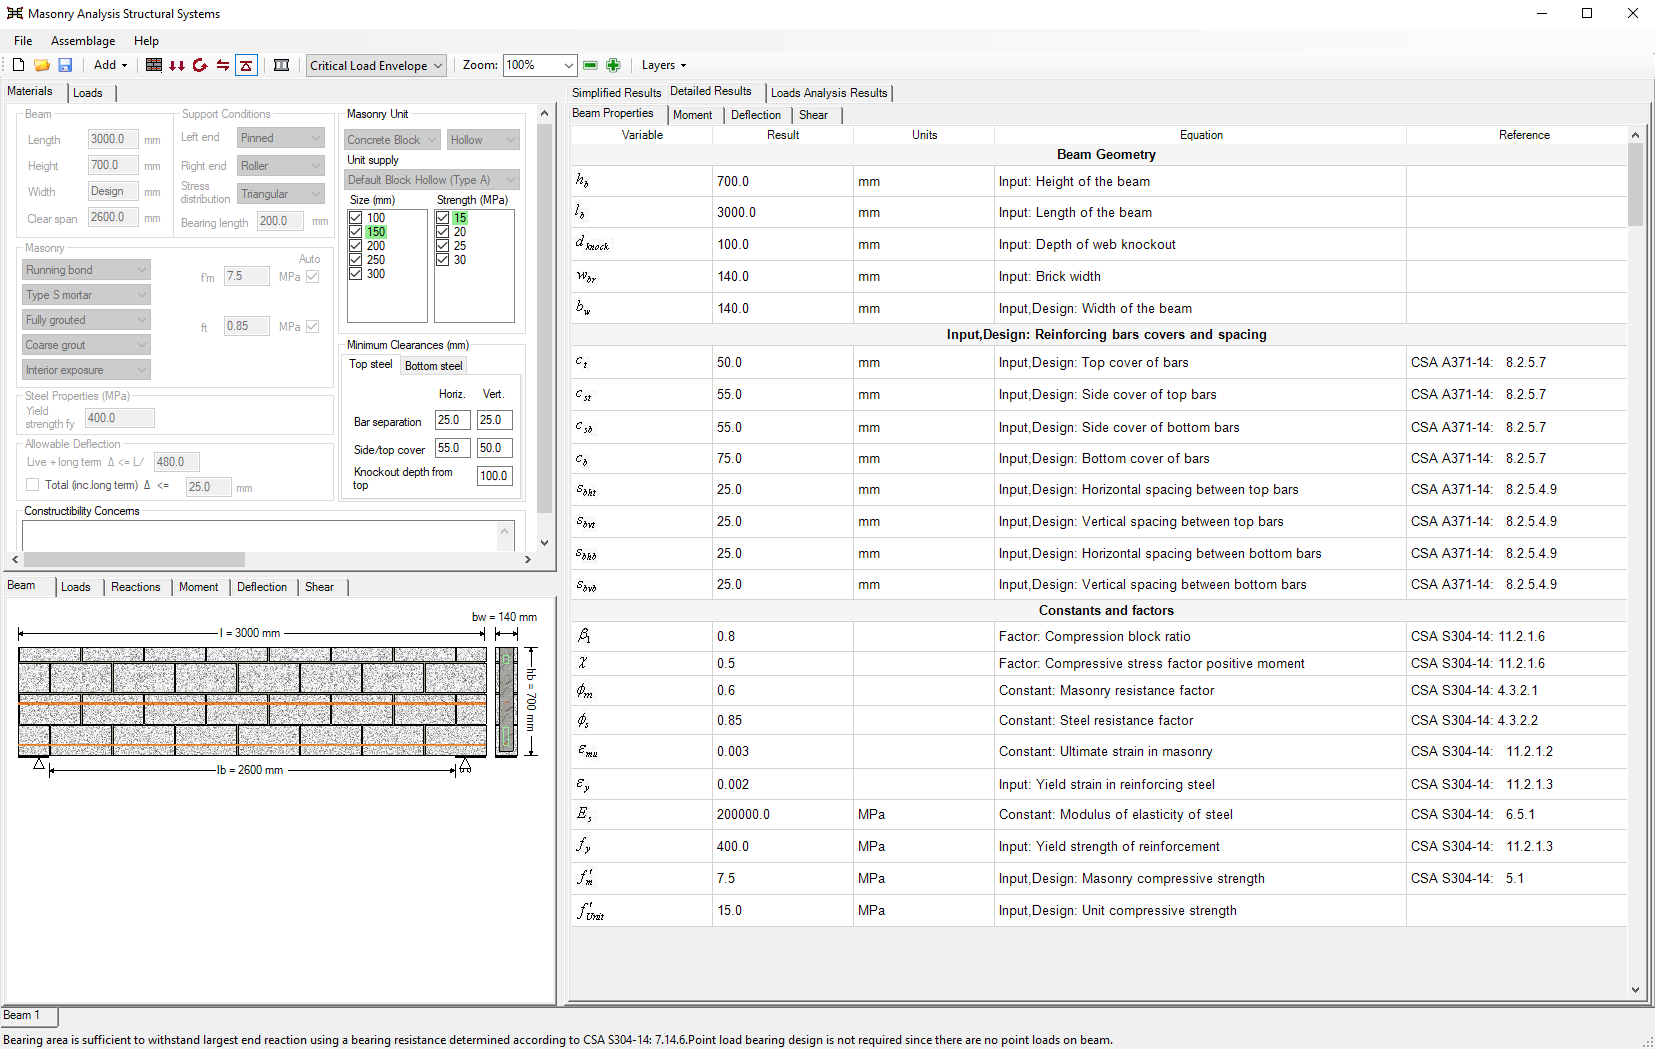
Figure 2‑27: Detailed Results (Beam Properties)
The Moment tab contains data specific to the moment design stage. The Detailed Results tab contains similar tabs for the deflection design, and shear design. For more information on using the detailed results refer to Beams, Out-of-Plane Walls, and Shear Walls sections of this user manual.
Loads Analysis Results
The Load Analysis Results tab provides the internal forces along the assemblage. The load analysis results contains two tabs; one for the moment and shear, and one for the deflection (not applicable for the shear wall module). The Moment and Shear tab provides a table with the internal moment and shear along equal intervals along the assemblage as well as at special interest points (for instance, the location of the largest moment value). The deflection provides a table of the immediate, long term, live+long term, and immediate+long term deflection along the beam assemblage; and a table of the primary deflection, and the secondary deflection (effects of slenderness) for out-of-plane walls. A sample loads analysis results table is shown in Figure 2‑28.
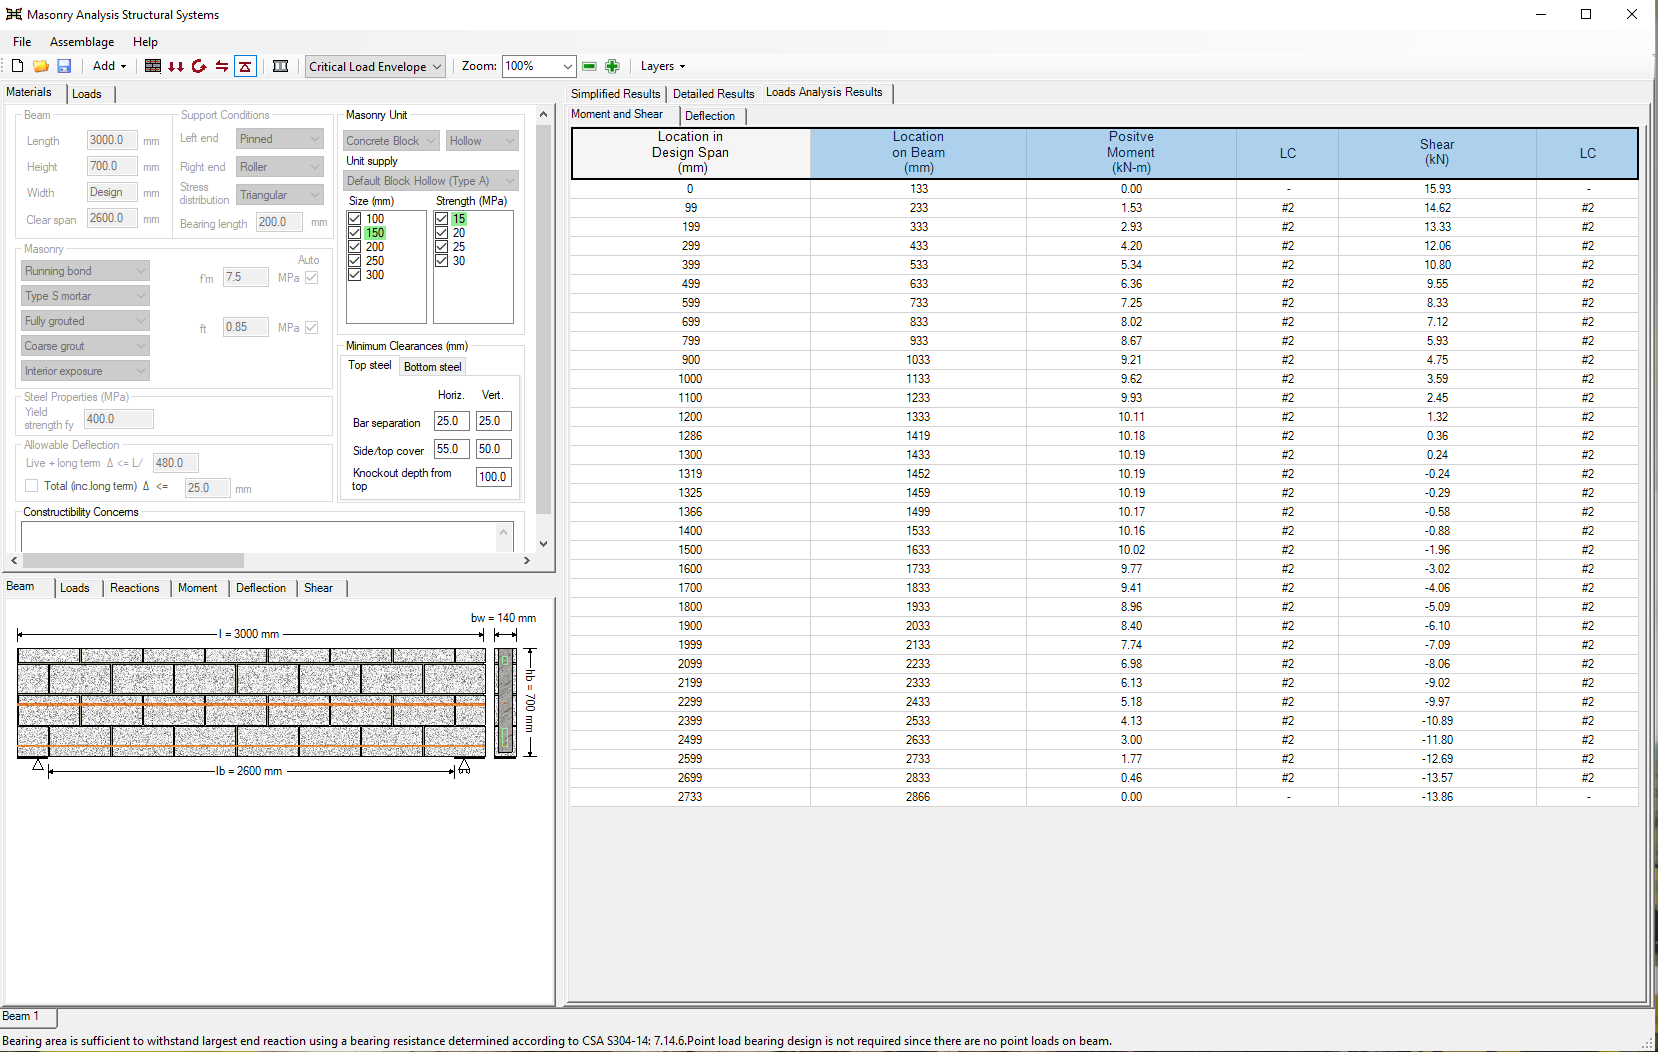
Figure 2‑28: Loads Analysis (Moment and Shear)
*Note: In general, the simplified results, detailed results, and load analysis results are available for a failed design so users can readily see why a particular design failed. However, if for instance, the design fails during the moment design stage, the program does not allow users to continue to shear design stage, and thus shear design results and bearing design results (in the case of beams) are not be available.
Continue Reading: Analysis
Was this post helpful?