

A Complete Beam Design
A beam design is complete when assemblage configuration design step, moment and deflection design step, shear design step, and bearing design step have been performed. Upon the completion of the beam design (whether it be successful or not), users have access to several output tabs. MASS™ is exceptionally transparent, providing the opportunity to quickly see exactly what equations the program used to achieve the design. This is extremely beneficial not only to users but to other designers that may review users’ work. As part of the results, the program provides detailed drawings that reflect the completed design, including: beam, loads, reactions, moment, shear, and deflection drawings. The program also provides tabulated results. There are three result categories available for each module: simplified results, detailed results, and loads analysis results. The three result categories vary in the amount of detail provided, but all contain separate tables that approximately correspond to each design step. All drawings and results can be readily printed.
All results explored in this section assume a completed beam design. The drawings and tabulated results are often available in advance of a completed solution. The availability of a specific drawing or tabulated result is mentioned at each step during the design procedure (discussed in the Beam Design Steps section).
Drawings
There are several useful drawings that the program provides in the beam module, including:
- Beam
- Loads
- Reactions
- Moment
- Shear
- Deflection
The first drawing becomes available as soon as the assemblage configuration design step is complete. The loads, reactions, moment, and shear drawings are not available until the loads input design step is performed. The deflection drawing is not available until the moment and deflection design step is performed. The beam drawing is updated at each design step to reflect any changes made to the assemblage. The drawings are not complete until all the design steps have been performed.
Beam
The beam drawing displays a beam with the material properties selected by users. The drawing displays the dimensions of the beam, as well as the detailed layout of the bricks or blocks used in the design. The drawing also displays the reinforcement used in the beam. To view the beam drawing:
- Click on the Beam tab in the bottom window (Figure 3‑54).
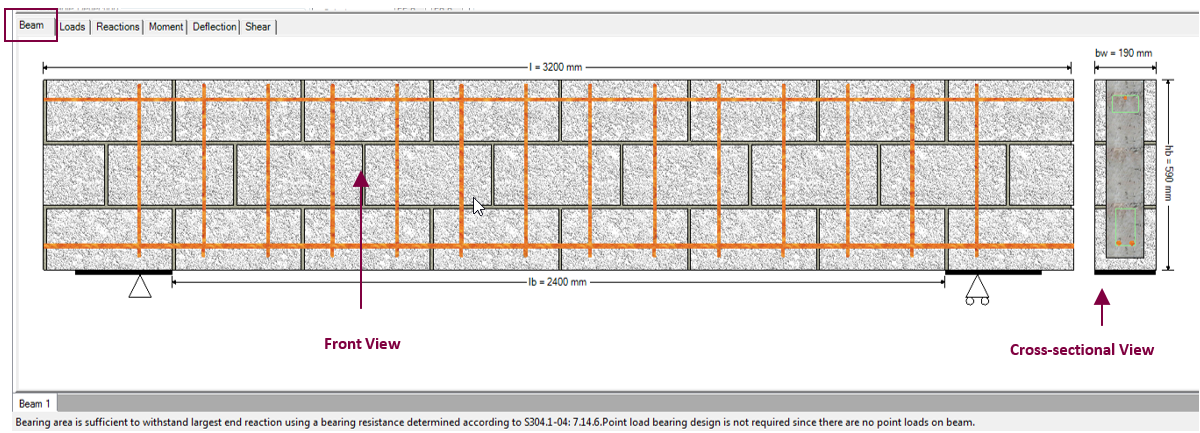
For the beam module, all drawings are displayed in the bottom window, with the dimensions (height, length, width) of the beam clearly labelled, as shown above in Figure 3‑54. The beam drawing includes the front view of the assemblages as well as the cross-sectional view of the beam.
In the front view, the actual length (3200 mm in Figure 3‑54) and the clear span (2400 mm in Figure 3‑54) are displayed. The placement of the horizontal and vertical reinforcement steel (if applicable) along the height and length of the beam is also shown. The horizontal, black line above the support (s) denotes the presence of a bearing plate.
![]() Warning: The reinforcing bars in the beam drawing extend to the ends of the beam as not to deceive users into thinking that the development length calculations had been performed. MASS™ does not perform any significant amount of detailing.
Warning: The reinforcing bars in the beam drawing extend to the ends of the beam as not to deceive users into thinking that the development length calculations had been performed. MASS™ does not perform any significant amount of detailing.
The exact placement of the masonry units is also shown. As discussed in the Assemblage Configuration section, beams that require cut units are outlined in red in this view. For beams that are non-modular in height or in length, cut-off blocks are highlighted in red to indicate a constructability concern. Cut-off blocks are placed and highlighted at the top of the beam height (in case of a non-modular height) and at the right end of the beam (in the case of a non-modular beam length). The program always forces the left end of the beam to start at either the end of a unit or at the half length of a unit. The program always forces the bottom of the beam to start at either the end of a unit or at the half length of a unit.
In the cross-sectional view, the width (190 mm in Figure 3‑54) and height (590 mm in Figure 3‑54) are displayed. The placement of the horizontal steel is also shown in more detail: the bars placed in each bar layer are displayed. As mentioned previously, the green boxes surrounding the steel layers indicate the space within which the reinforcement bars must fit based on the minimum clearances selected by users.
For drawings available in MASS™, users are permitted to select the amount of detail displayed in the drawing. With the Layers drop-down box (shown in Figure 3‑55), users can choose to include or exclude several drawing layers. This feature is available for all drawings in the beam module; however, the specific layers available may vary.
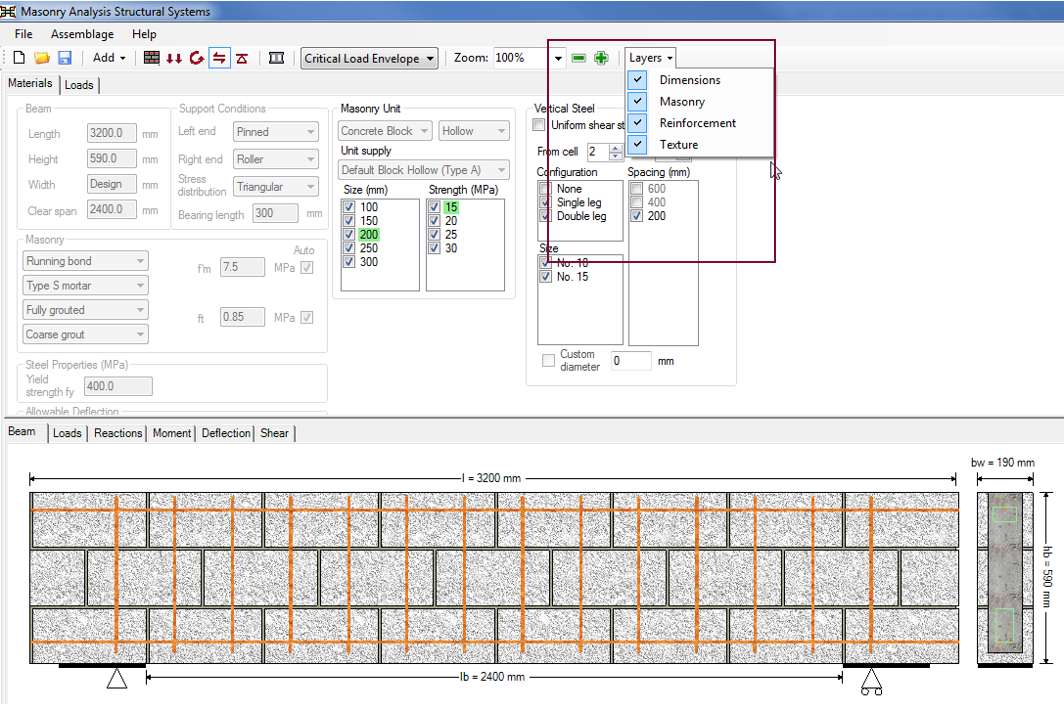
Figure 3‑55: Customizing Drawings Using the Layers Drop-Down Box
For the beam shown in Figure 3‑55, the following layers can be included or excluded:
- Dimensions
- Masonry
- Reinforcement
- Texture
For instructions on printing the drawings, refer to the section pertaining to Printing.
Loads
The loads drawing displays the loads that are applied to the beam. It is completed during the loads input design. To view the loads drawing:
- Click on the Loads tab in the bottom window (Figure 3‑56).
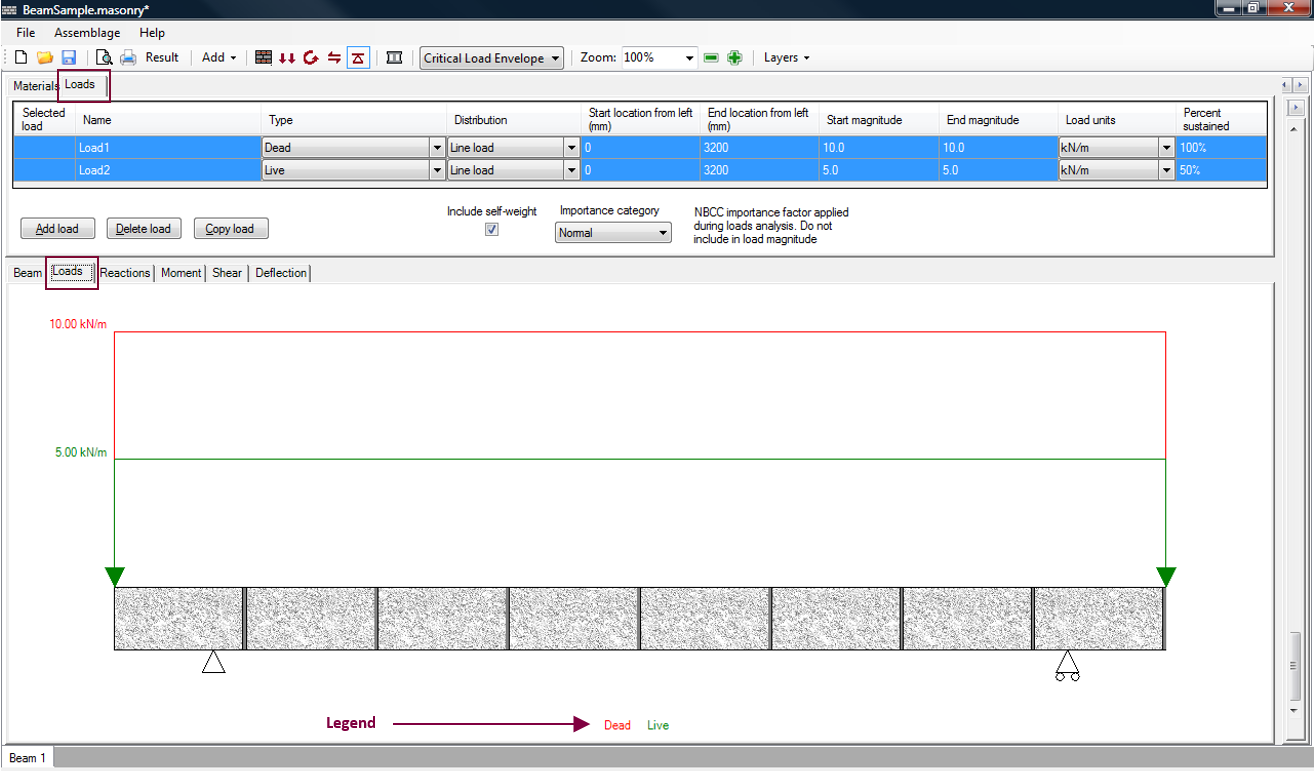
A specific applied load can be viewed under the Loads tab by clicking on the box of that particular load, under the ‘Selected load’ column. Multiple loads can be viewed by holding down Shift key, and selecting the loads to bed displayed. Figure 3‑56 shows two selected loads that are displayed in the loads drawing. The applied loads that are selected are highlighted in blue.
Each load type applied is displayed using a different colour (the legend shown is displayed below the beam in the beam drawing). The dead load is displayed in red, and the live load is displayed in green. A full list of all load types available in the beam module, as well as their corresponding colour, are listed in Table 3‑6: Load Type Colour Convention.
Table 3‑6: Load Type Colour Convention

Reactions
The reactions drawing displays the support reactions that are applied to the beam, due to a chosen load combination. It is completed during the loads input design step. The drawing is updated at each design step to reflect any changes made to the assemblage.
To view the reactions drawing:
- Click on the Reactions tab in the bottom window (Figure 3‑57: Reactions Drawing‑).
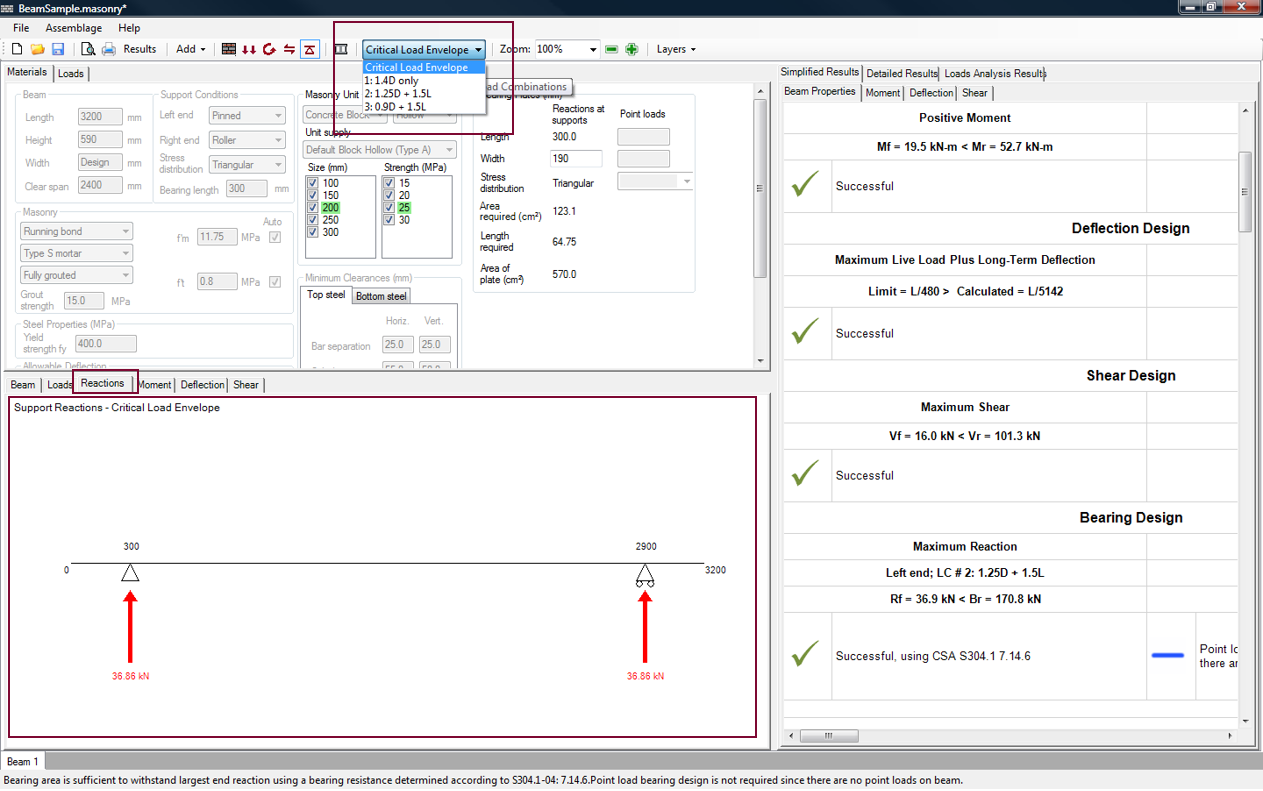
Figure 3‑57: Reactions Drawing
By default, the reactions drawing displayed uses the critical load envelope (formed by the worst case of all load combinations at any point along the beam). Reactions due to specific load combinations can be viewed by clicking on the Critical Load Envelope drop-down box, as shown in Figure 3‑57. The drawing indicates at the top left corner the load combination used to determine that specific reaction.
Reaction forces (as well as moment and shear curves) are displayed using red, green, or both. Red is used to identify a positive reaction force (up). Green is used to identify a negative reaction force (down).
Moment reaction arrows follow a similar scheme. A red moment arrow at the left end of the beam indicates a positive moment reaction (clockwise). A green arrow at the left end of the beam indicates a negative moment reaction (counter-clockwise). A red arrow at the right end of the beam indicates a positive moment reaction (counter-clockwise). A green arrow at the right end of the beam indicates a negative moment reaction (clockwise).
Note: Any loads applied at the overhangs (outside of the design span) are transferred into the supports (the reactions drawing reflects this). The beam however, is designed for loads applied within the design span only (the shear, moment and deflection drawings reflect this).
Moment
The moment drawing exhibits the moment applied along the length of the beam due to the applied loads and moments of a chosen load combination. It is completed during the loads input design step. The drawing is updated at each design step to reflect any changes made to the beam. A change in the masonry unit size for instance, affects the self-weight of the beam, and thus the applied moment.
To view the moment drawing:
- Click on the Moment tab in the bottom window (Figure 3‑58: Moment Drawing‑).

By default, the moment drawing displayed uses the critical load envelope (formed by the worst case of all load combinations at any point along the length of the beam). A moment corresponding to a specific load combination can be viewed by clicking on the Critical Load Envelope drop-down box. The drawing indicates at the top left corner the load combination used to determine that specific moment diagram.
For the critical load envelope selection only, moment diagrams are displayed using red, green, or both. A red moment curve indicates a positive moment (bottom of beam is in tension). A green moment curve indicates a negative moment (bottom of beam is in compression). Maximum absolute positive and negative moments are indicated as dots, (unless the maximum absolute moment is zero, i.e. there is no negative moment). For all other load combinations the moment diagrams are displayed using a red curve.
Deflection
The deflection drawing displays the deflection of the beam due to the applied loads and moments of a chosen load combination. It is first displayed during the moment and deflection design step. The drawing is updated at each design step to reflect any changes made to the assemblage.
To view the deflection drawing:
- Click on the Deflection tab in the bottom window (Figure 3‑59).
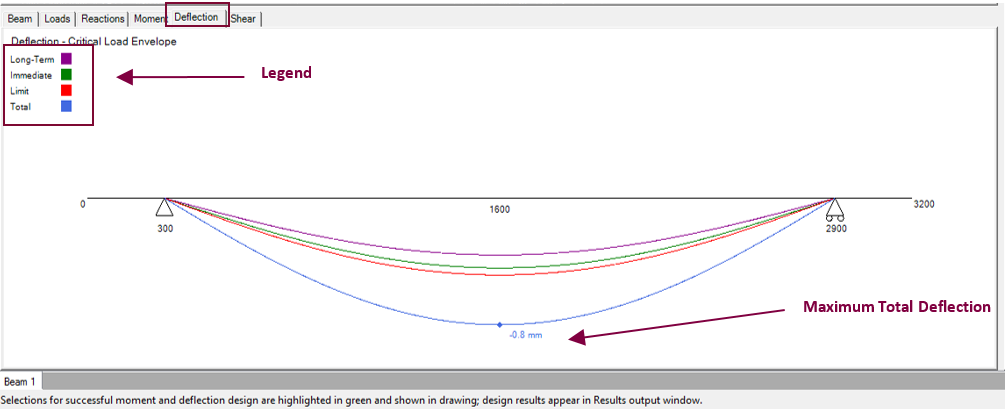
Figure 3‑59: Deflection Drawing
The deflections the out-of-plane wall experiences are displayed using different colours (the legend is featured in the top left corner of the beam drawing). The live+long-term deflection limit is also provided. Description of these deflections, as well as other common deflection terms are provided in Table 3‑7: Deflections Displayed in Deflection Drawing.
Table 3‑7: Deflections Displayed in Deflection Drawing
|
Deflection |
Description |
|
Immediate |
Deflection when all loads of a particular load combination are applied on the beam. |
|
Limit |
The maximum allowable live+long term deflection is L/480, where L is the design length of the beam (governed by CSA S304-14: 11.4.5). |
|
Live Load |
This represents the deflection caused by the following loads: live, snow, wind, earthquake, storage, soil, and controlled fluids. |
|
Long-Term |
Deflection caused by sustained loads (for a particular load combination). It is calculated by multiplying the immediate deflection by a time dependent factor (given by CSA S304-14: 11.4.4). In MASS the beam deflection design assumes that all sustained loads are applied for a period greater than 5 years (S1 = 1.0). |
|
Sustained Deflection |
This is the immediate deflection caused by all sustained loads (i.e.: dead 100% sustained, live 50% sustained, snow 60% sustained, earthquake 20% sustained, wind 50% sustained, etc). |
|
Total |
In MASS, this is the total immediate deflection plus the long-term deflection. |
For the total deflection curve, the maximum absolute positive and negative deflections are indicated with dots.
By default, the deflection drawing displayed uses the critical load envelope (formed by the worst case of all load combinations at any point along the beam). Deflections corresponding to a specific load combination can be viewed by clicking on the Critical Load Envelope drop-down box. The critical load combination for deflection design may be different than the critical load combination used for moment design. The deflection drawing indicates at the top left corner the load combination used to determine that specific moment diagram.
Shear
The shear drawing displays the shear applied along the length of the beam due to the applied loads and moments of a chosen load combination. It is first displayed during the loads input design step. The drawing is updated at each design step to reflect any changes made to the beam. For example, during the shear design step, the shear resistance and shear design curves are added to the actual shear curve.
To view the shear drawing:
- Click on the Shear tab in the bottom window (Figure 3‑60: Shear Drawing‑).
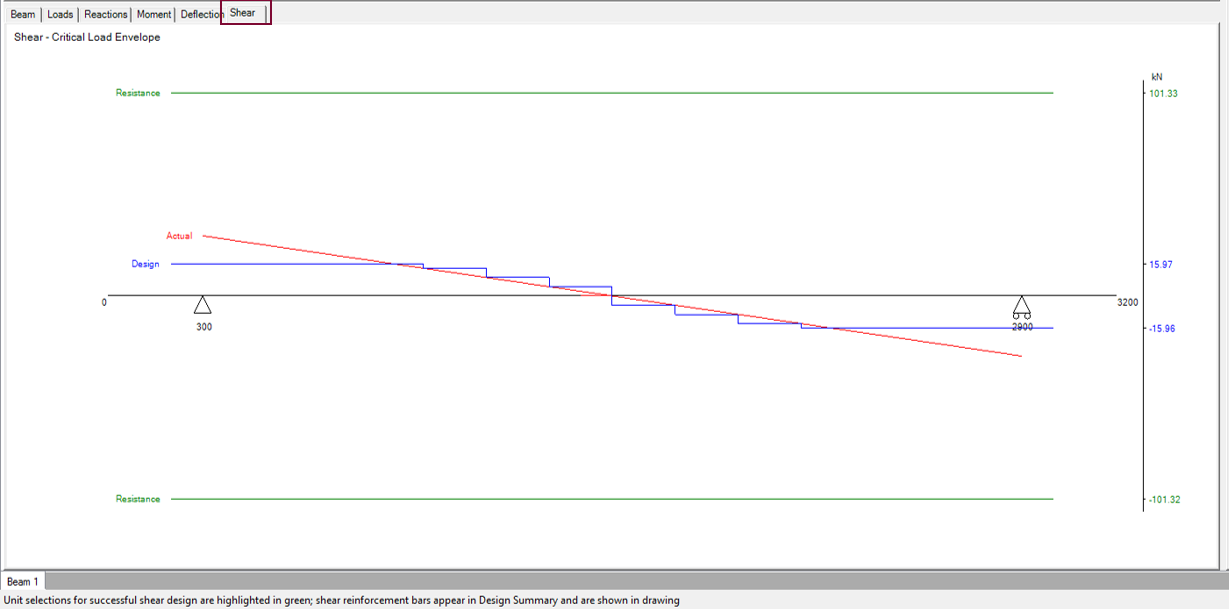
Completing the shear design step updates the shear drawing. In addition the actual (applied) shear (displayed at the loads input design stage), the design shear and shear resistance curves are also displayed, as shown in Figure 3‑60: Shear Drawing‑.
The actual shear is the shear the beam experiences due to the applied loads and moments. This curve is determined by the loads analysis engine, and is plotted, in red, between the centres of support. The design shear is the factored shear the beam experiences, assuming the shear is constant along each cell, and is capped near the supports (following CSA S304-14: 11.3.4.2). The design shear must be exceeded by the shear resistance for the beam design to pass. This curve is drawn in blue in Figure 3‑60. Notice that it extends from the start of the first cell that is within the design span to the end of the last cell within the design span, so it extends a little further on each end than the actual shear curve. The shear resistance is the shear capacity of the beam, calculated based on CSA S304-14: 11.3.4. This curve is drawn in green, and extends from first to last design cell.
The shear diagram corresponding to a specific load combination can be viewed by clicking on the Critical Load Envelope drop-down box. The drawing indicates at the top left corner the load combination used to determine that specific shear diagram.
A shear drawing with the design shear is available only for the critical load combination since this is the load combination the design shear is determined for. The actual shear and shear resistance can be viewed for all load combinations.
Simplified Results
There are three tabulated result categories available in the beam module: simplified results, detailed results, and loads analysis results. The three result categories vary in the amount of detail provided, but all contain separate tables that approximately correspond to each design step, as shown in Figure 3‑61: Tabulated Results Categories for Beam Module: Simplified, Detailed, Loads Analysis‑.
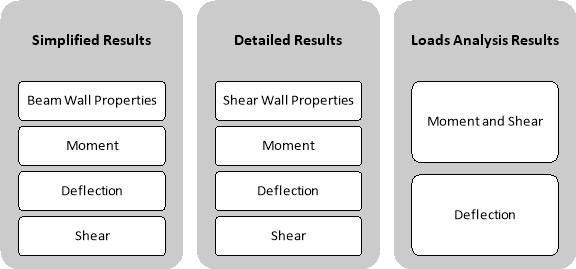
Figure 3‑61: Tabulated Results Categories for Beam Module: Simplified, Detailed, Loads Analysis
The simplified results show only those values that are required to give an overview of the results for a design criterion. The simplified results contains four tabs which provide design summaries for:
- Beam Properties
- Moment
- Deflection
- Shear
The first three tabs become available as soon as the moment and deflection design step is performed. The Shear tab is not available until the shear design step is performed. The simplified results tabs are updated at each design step to reflect any changes made to the beam design. The four simplified results tabs are not complete until all the design steps have been performed. For instructions on printing the Simplified Results tab, Detailed Results tab, or Loads Analysis Results tab, refer to the section pertaining to Printing.
Beam Properties
To view the ‘Design Results Summary’:
- Click on the Simplified Results tab
- Click on the Beam Properties tab
The Beam Properties tab contains a summary table (titled ‘Design Summary Results’) that quickly advises users of the design stages that have been satisfied. The design steps that provide a successful design are indicated with a green check mark. The design steps that do not provide a successful design are indicated with a red ‘X’. Design steps that are yet to be performed are indicated with a blue horizontal line. The Beam Properties tab also contains a summary of the material properties that were used in the design. In general, the data presented in this tab is common to more than one design step (Figure 3‑62).

Figure 3‑62: Simplified Results (Beam Properties)
At the top of the design summary page, the moment and deflection design steps are summarized.
The maximum factored moment, Mf, is the maximum moment the beam experiences due to the applied loads and moments (based on the critical load envelope). In this example, Mf is 19.5 kN-m (also shown in the Moment tab, and in the Loads Analysis Results tab). The factored moment resistance, Mr , is the moment resistance of the beam, based on the design provided by MASS™. In this example, the moment resistance of the beam is 52.7 kN-m. Notice that the results are displayed in the ‘Positive Moment’ column, because the current design only contains a positive moment. For beams with only a negative moment, the results are displayed in the ‘Negative Moment’ column. For beams with positive and negative moments, both results are displayed.
The maximum live load plus the long term load (sustained) deflection is summarized and compared against the limit provided by users during the moment and deflection design step. By default, this value is L/480 mm.
The maximum factored shear (maximum design shear), Vf, is the maximum shear the beam experiences due to the applied loads and moments (based on the critical load envelope). In the example shown in Figure 3‑62, the maximum factored shear is 13.9 kN (also shown in the Shear tab). The factored shear resistance, Vr, is the shear resistance of the beam, based on the design provided by MASS™. In this example the shear resistance along the length of the beam is 15 kN.
Below the shear design results, the bearing design results are displayed. The factored reaction force, Rf , is the maximum reaction the beam experiences at any support, for any load combination. In the example shown in Figure 3‑62 the reaction force is 36.9 kN. The bearing resistance, Br , is the resistance the bearing plate has to local compressive stresses. In this example, the resistance of the bearing plates (used at both supports) is 170.8 kN. Notice that the support, and the load combination that resulted in the largest reaction are also displayed (Figure 3‑63). Once again, although the bearing area can be different for each point load, this version of the program uses the maximum point load along the beam to perform the bearing design, and assigns the same bearing area to all point loads.
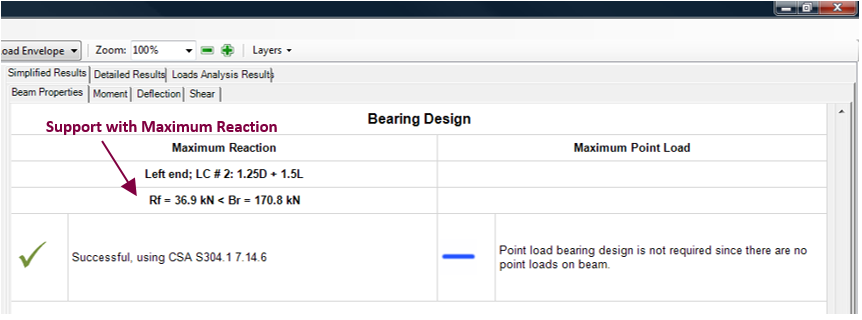
Figure 3‑63: Design Results Summary (Bearing Design)
When a bearing plate is included to account for point loads, the factored point load, Pf , is the maximum point load the beam experiences at any support, for any load combination. The bearing resistance, Br , is the resistance the bearing plate has to local compressive stresses.
![]() Warning: The bearing resistance is calculated using CSA S304-14: 7.14.6. Detailed bearing resistance analysis is left up to the designers (refer to CSA S304-14: 7.14).
Warning: The bearing resistance is calculated using CSA S304-14: 7.14.6. Detailed bearing resistance analysis is left up to the designers (refer to CSA S304-14: 7.14).
Further along the ‘Design Summary Results’ page, the beam properties and the applied load information are provided. The beam properties provided include the beam dimensions, support and bearing information, masonry properties, as well as the unit properties used to attain the beam design (Figure 3‑64).
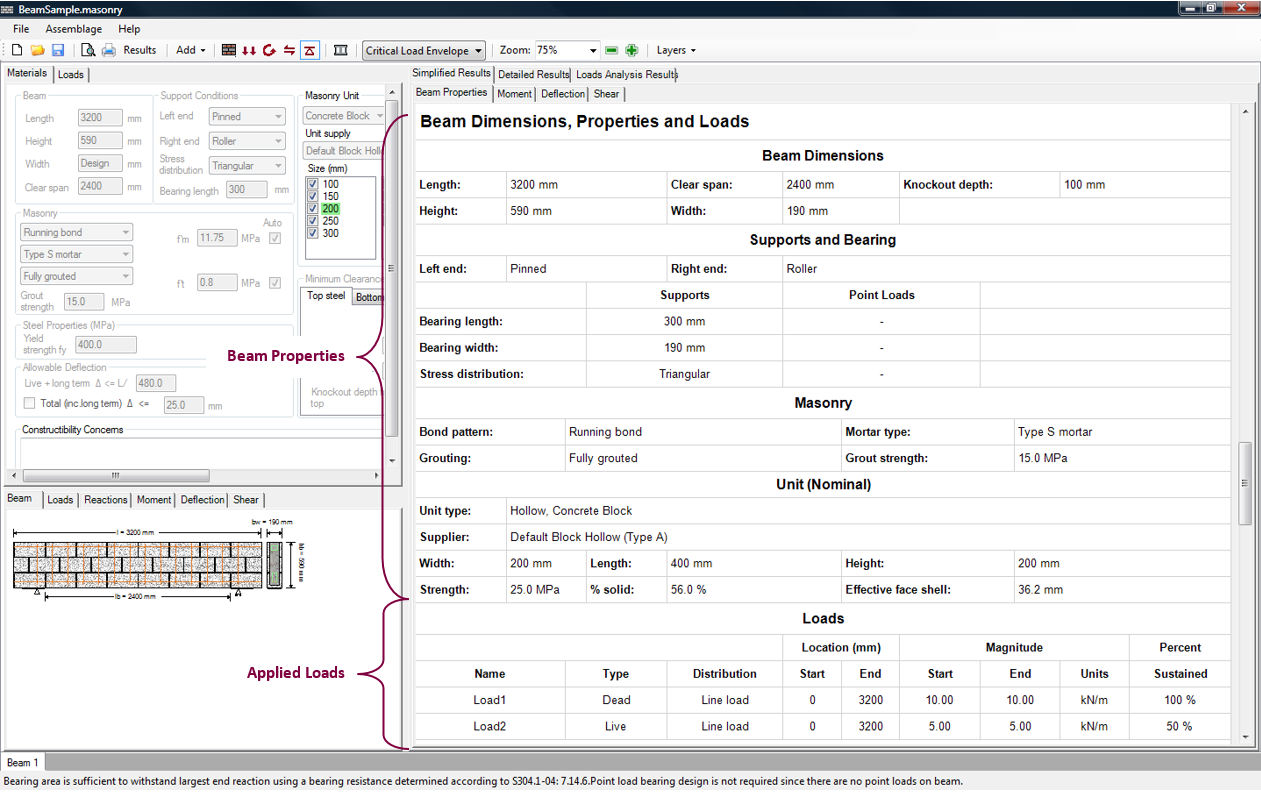
Figure 3‑64: Simplified Results (Beam Properties)
The applied loads information includes a list of all the loads applied to the beam (along with their location, unfactored magnitude, and percent sustained), a list of all the load combinations (used in the moment and deflection design step, and the shear design step), and a list of all the load types applied by users.
Moment
To view the ‘Moment Design Summary’:
- Click on the Simplified Results tab
- Click on the Moment tab
The Moment tab contains a summary table (titled ‘Moment Design Summary’) that quickly advises users if the moment design (during the moment and deflection design step) has been satisfied. A successful moment design is indicated with a green check mark. An unsuccessful moment design is indicated with a red ‘X’. The Moment tab also contains a summary of the moment calculations, as well as the horizontal steel properties (Figure 3‑65).
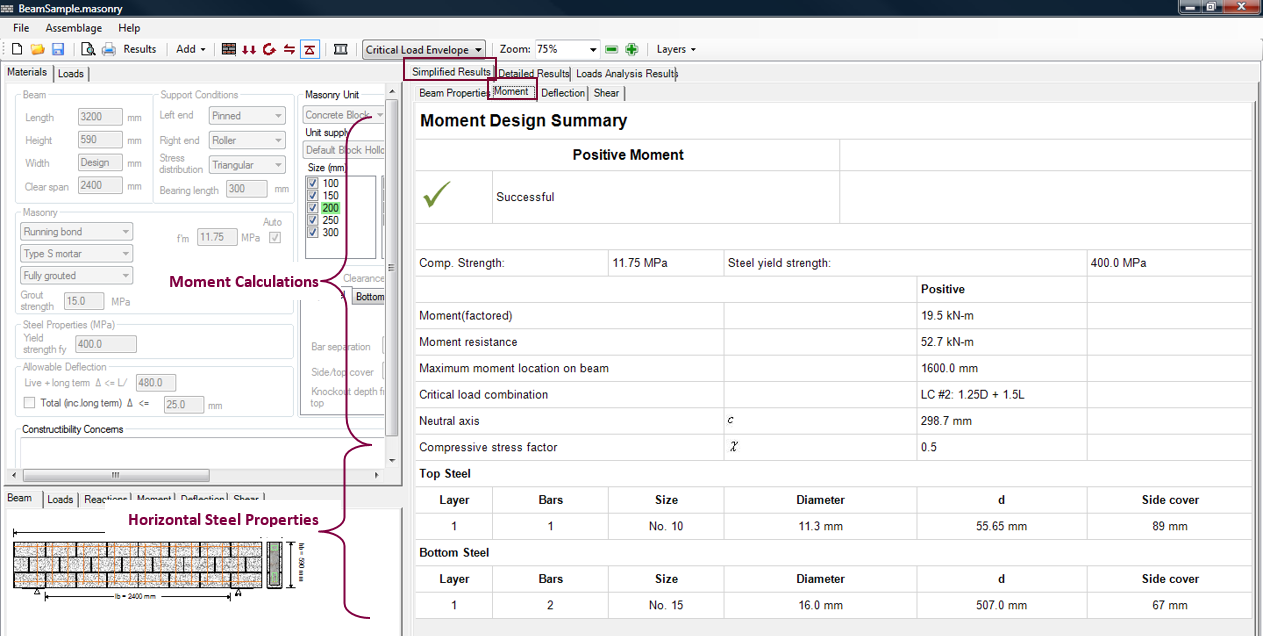
Figure 3‑65: Simplified Results (Moment)
The summarized moment calculations include the maximum moment, Mf , experienced by the beam, the location of the maximum moment, and the moment resistance Mr. The critical load combination (the load combination that results in the largest moment) is also displayed, along with the neutral axis depth C.
The summary also provides the stress orientation factor X . In masonry design, this factor is used when the equivalent rectangular stress block is used. It accounts for the direction of compressive stress and the continuity of grout in masonry elements. The compressive strength of masonry f’m, is determined for compression normal to the bed joint in a member. When the compression stress is applied parallel to the bed joint the values for compression strength are lower. For compression normal to the bed joint, X=1.0; for compression parallel to the bed joint, X=0.5, unless grout is continuous in the direction of the compressive force (cavity between wythes, or when lintel or web blocks are used), in which case X=0.7.
In addition to the moment calculations, the Moment tab also provides the horizontal steel properties. The summarized horizontal steel properties include the bar size, bar diameter, depth to the centroid of a bar layer, d, and side cover for horizontal steel placed towards the top of the beam (typically, compression steel), for intermediate steel, and for horizontal steel placed towards the bottom of the beam (typically, tension steel).
Deflection
To view the ‘Deflection Design Summary’:
- Click on the Simplified Results tab
- Click on the Deflection tab
The Deflection tab contains a summary table (titled ‘Deflection Design Summary’) that quickly advises users if the deflection design (during the moment and deflection design step) has been satisfied. The Deflection tab also contains a summary of the deflection calculations performed by the program (Figure 3‑66).
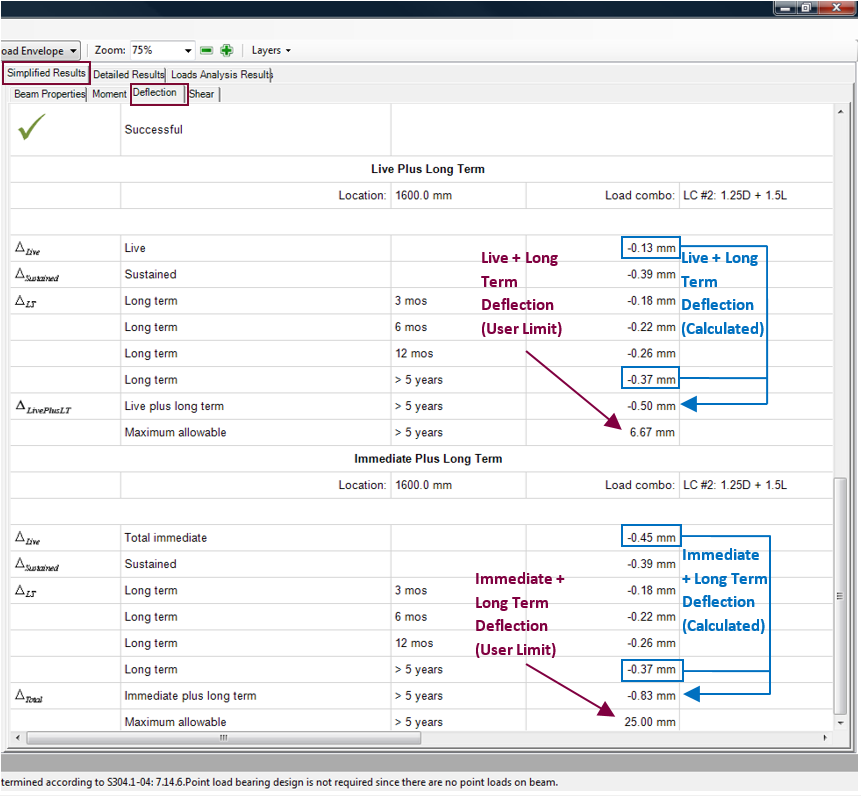
Figure 3‑66: Simplified Results (Deflection)
The summarized deflection calculations include: the live deflection ΔLive, the sustained deflection ΔSustained , the long term deflections ΔLT, (needed to determine the live + long term deflection), and the total deflection ΔTotal. In addition, the deflection limits specified by users (using ‘Allowable Deflection’ box), are also included.
The critical load combination (load combinations that results in the largest deflection live+long term and immediate+long term deflections) is also displayed, along with the neutral axis depths.
Shear
To view the ‘Shear Design Summary’:
- Click on the Simplified Results tab
- Click on the Shear tab
The Shear tab contains a summary table (titled ‘Shear Design Summary’) that quickly advises users if the shear design is successful. A successful shear design is indicated with a green check mark. An unsuccessful shear design is indicated with a red ‘X’. The Shear tab also contains a summary of the shear calculations, as well as the vertical steel properties (Figure 3‑67).
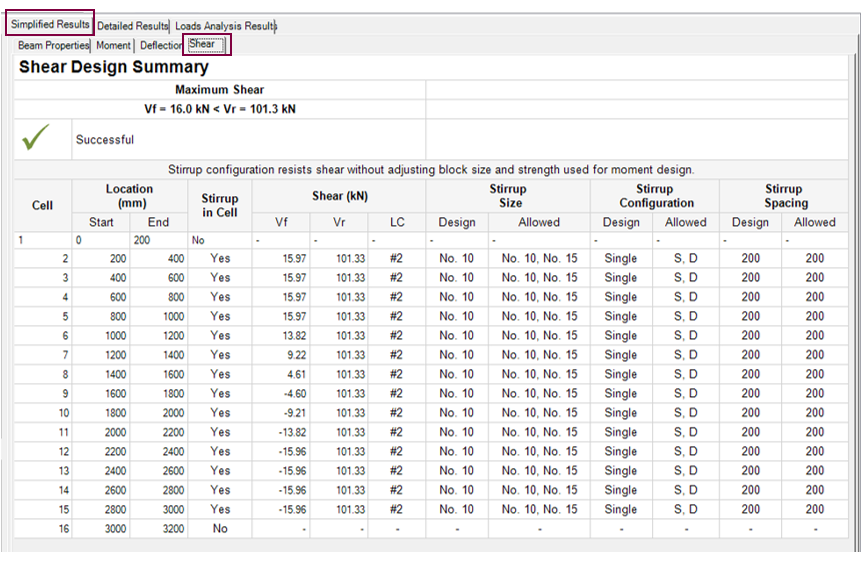
Figure 3‑67: Simplified Results (Shear)
The summarized shear results include the location of each cell, and whether or not the cell contains a stirrup. This result table also provides the factored shear, Vf, and the corresponding load combination ‘LC’ for each cell as well as the shear resistance, Vr for each cell.
Because the design presented in Figure 3‑67 contains stirrups, the ‘Design’ column (under the ‘Stirrup Size’ title) contains the bar size used in each cell; the ‘Design’ column, (under the ‘Stirrup Configuration’ title) lists ‘Single’ as the stirrup configuration; and, the ‘Design’ column (under the ‘Stirrup Spacing’ title) contains the spacing for each cell.
Should the user wish to add stirrups to the current design, the bar sizes that are permitted are listed in the ‘Allowed’ columns. Values found under the ‘Allowed’ columns are based on geometry restrictions as well as CSA standards. The bar sizes that are permitted are listed under the ‘Stirrup Size’ title. The stirrup configurations that are permitted are listed under the ‘Stirrup Configurations’ title. In Figure 3‑67, the allowed stirrup configurations are N, S, D, which stand for None, Single-leg or Double-leg. The bar spacings that are permitted are listed under the ‘Stirrup Spacing’ title.
Detailed Results
The detailed results provide the intermediate calculations performed to obtain the final beam design. The detailed results are organized into tables that include:
- Variables used in the design
- Calculated result (of the successful design run or the last unsuccessful design run)
- Units employed
- Engineering equations (or descriptions of the origin of the values in the absence of equations)
- CSA standard reference (where applicable)
The detailed results contain four tabs which provide design information for:
- Beam Properties
- Moment
- Deflection
- Shear
The first three tabs become available as soon as the moment and deflection design step is performed. The Shear tab is not available until the shear design step is performed. The Detailed Results tabs are updated at each design step to reflect any changes made to the beam design. The four Detailed Results tabs are not complete until all the design steps have been performed.
Beam Properties
To view a full list of the beam properties:
- Click on the Detailed Results tab
- Click on the Beam Properties tab
The Beam Properties tab contains a table that provides detailed information about the beam geometry, the reinforcement cover and spacing values, and any applicable constants and factors. In general, the data presented in this Beam Properties tab is common to more than one design step (Figure 3‑68).

Figure 3‑68: Detailed Results (Beam Properties)
In cases where the variable/symbol is not governed by a specific equation, a description of the variable is provided instead. Because all the variables listed in Figure 3‑68 contain a description, a further examination of these variables is not performed.
Moment
To view a full list of the moment design results:
- Click on the Detailed Results tab
- Click on the Moment tab
The Moment tab contains a table that provides detailed information about the reinforcement properties (quantity, diameter, area), the reinforcement location, and the design for positive moment, negative moment, or both (if applicable). In general, the data presented in this Moment tab approximately corresponds to the calculations performed in the moment and deflection design step.
The first set of variables to be displayed are the reinforcement properties (quantity, diameter, area), as shown in Figure 3‑69.
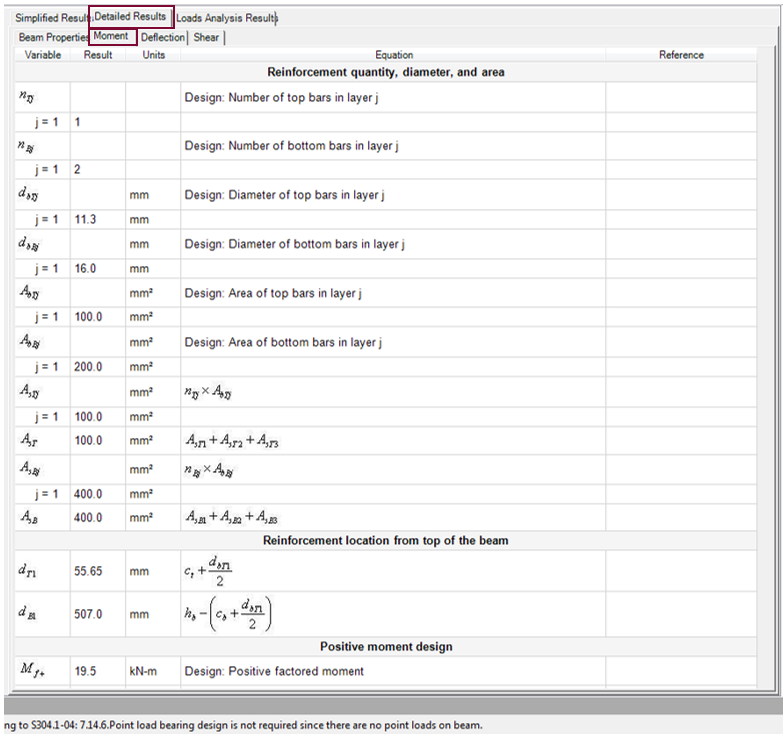
Figure 3‑69: Detailed Results (Moment)
Notice that the detailing for the horizontal bars is minimal. For example, horizontal bars are often hooked at the ends to anchor the bar and help develop its yield strength in a shorter distance. However, MASS™ only provides basic detailing calculations (it does not account for hook ends).
Scrolling down further to the ‘Positive Moment Design’ heading, users can view the moment calculations. Variables and equations presented in the Detailed Results tab are typically listed in order of importance. Most variables pertaining to a specific equation are listed directly below it. An example of this can be seen with the Mr+ equation. Mr+ requires knowing Cm, Cm Cx ‘ and Tx. These equations in turn require knowing several more variables.
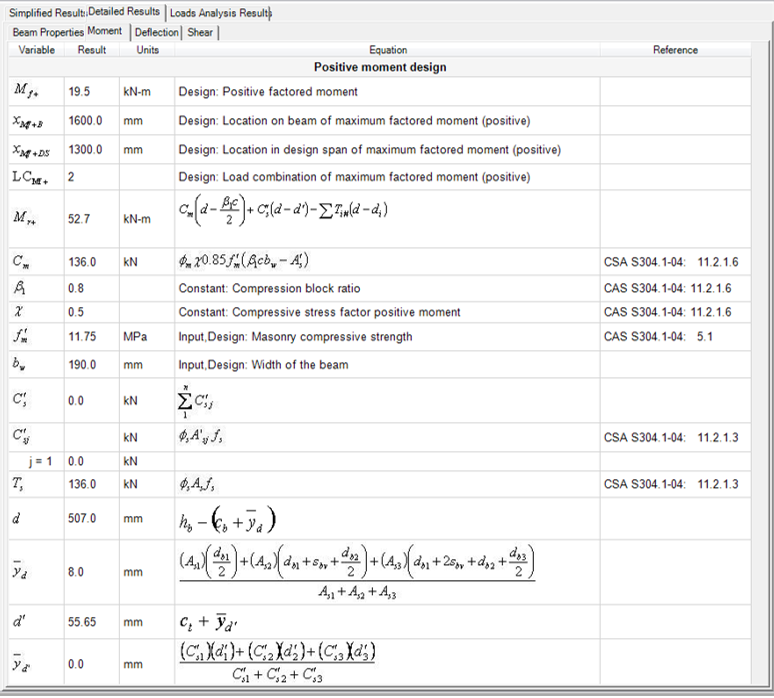
Figure 3‑70: Detailed Results (Moment)
Notice that most of the variables that are listed in Figure 3‑70 are ones that are commonly found in masonry design textbooks.
Deflection
To view a full list of the deflection design results:
- Click on the Detailed Results tab
- Click on the Deflection tab
The Deflection tab contains a table that provides detailed information about the positive moment deflection or negative moment deflection (or both where applicable). In general, the data presented in this Deflection tab approximately corresponds to the calculations performed in the moment and deflection design step.
The equations used to determine the deflection due to positive moment is shown in Figure 3‑71. The deflection due to negative moment is not displayed in the example, because this particular beam does not experience negative moment.
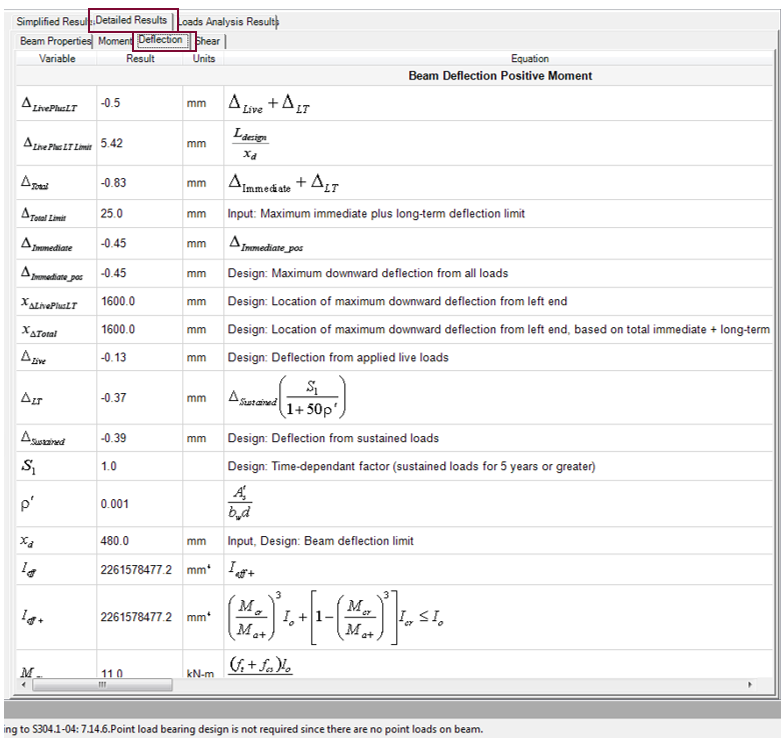
Figure 3‑71: Detailed Results (Deflection)
Shear
To view a full list of the shear design results:
- Click on the Detailed Results tab
- Click on the Shear tab
The Shear tab contains a table that provides detailed information about the shear design calculations as well as shear values at the critical cell (cell experiencing the largest factored shear), as shown in Figure 3‑72.
In general, the data presented in this Shear tab approximately corresponds to the calculations performed in the shear design step.
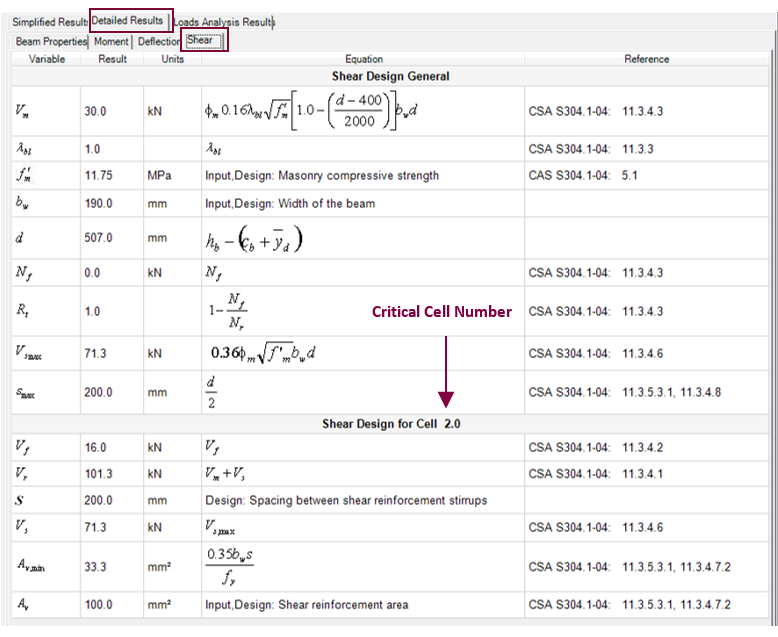
Figure 3‑72: Detailed Results (Shear)
Note: There are no detailed results for bearing design. All values are displayed in the Materials tab as well as the Simplified Results→Beam Properties tab.
Loads Analysis Results
MASS™ uses a finite element analysis to determine the reactions at the supports, and the values of bending moment, shear force, and deflection at any point along the assemblage. The finite element analysis engine contains a load combination generation engine, and is able to perform the analysis on all the load combinations mandated by the 2005 National Building Code of Canada (NBCC).
The Load Analysis Results tab is activated when loads are placed on the beam (during the loads input design step). It shows information about the factored moment, factored shear, and deflection at points of interest along the length of the beam. The load analysis results contain two tabs:
- Moment and Shear
- Deflection
Moment and Shear
To view the factored moment and factored shear data:
- Click on the Loads Analysis Results tab
- Click on the Moment and Shear tab
The Moment and Shear tab contains a table with the factored moment and factored shear at points of interest along the beam. The interval of the points of interest varies depending on the beam length:
- 100 mm intervals for beams less than or equal to 5 metres
- 200 mm intervals for beams greater than 5 metres but less than or equal to 10 metres
- 400 mm intervals for beams greater than 10 metres
Note that these intervals all divide equally into a modular length. Additional points are included at the following locations:
- At point load locations
- At the start and end of partial line loads
- At the value of maximum and minimum moment, which is determined by the load analysis engine using a finite element mode
- At the centre of the beam
Note: The number of points of interest is limited to 50 to avoid voluminous output.
A sample loads analysis results table for moment and shear is shown in Figure 3‑73.
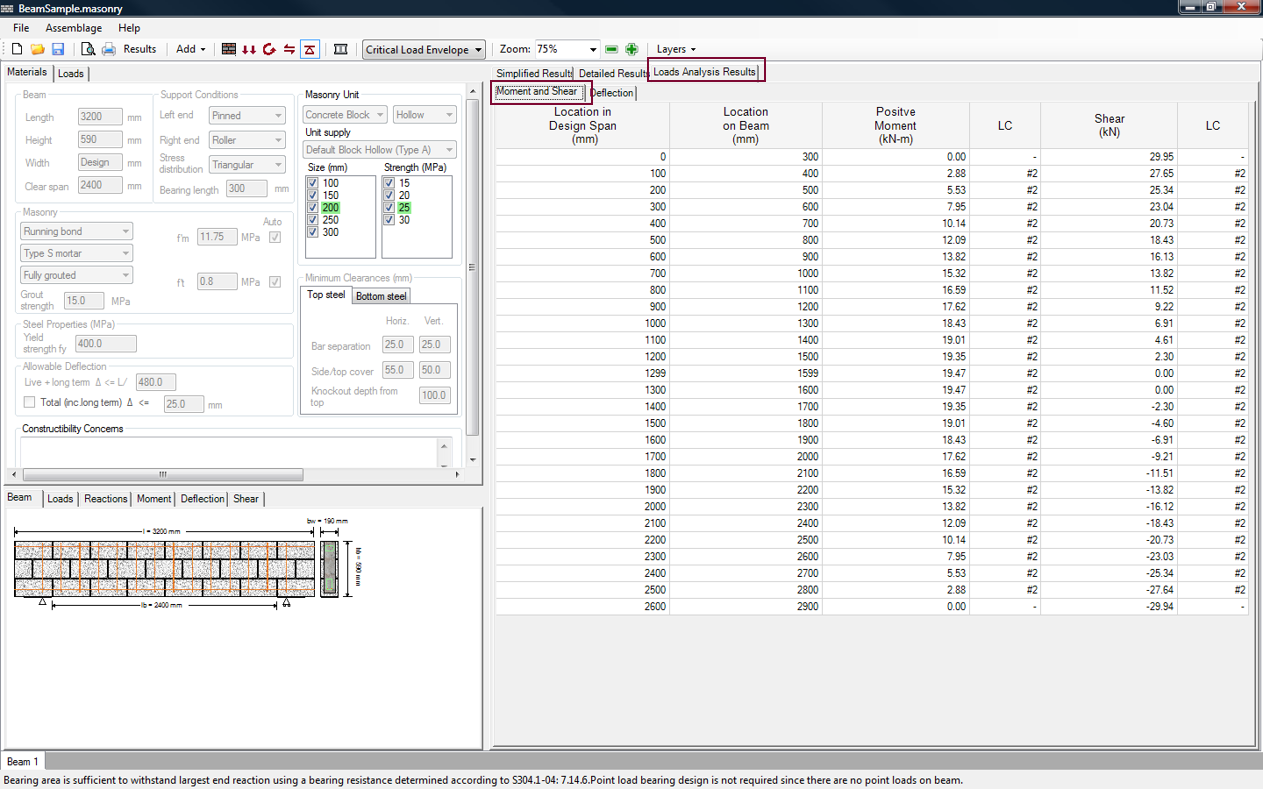
Figure 3‑73: Loads Analysis Results (Moment and Shear)
The first and second columns of the table indicate the location of the points of interest on the beam, from left to right; the first column shows the location with respect to the design length (distance between supports), and the second column the location with respect to the actual length (starting from the beginning of the left overhang). The following columns indicate the factored moment and shear at the points of interest location.
Note: If the beam is submitted to positive and negative moments, the table in the Moment and Shear tab provides additional columns for the negative moment and the corresponding load combination.
When critical load envelope is selected, from the Critical Load Envelope drop-down box, the value displayed is the largest of moment or shear values for all load combinations; and, the ‘LC’ column shows the number of the load combination for that particular moment or shear value. If a particular load combination is selected (i.e.: 2: 1.25D + 1.5L), the columns show the moment or shear values at the location of the points of interest for that particular load combination; and, the ‘LC’ column shows the number of the load combination selected.
Note: Changing the load combination (using the Critical Load Envelope drop-down box) alters the loads analysis results that are displayed. The beam, however, is always designed to resist the critical load combination.
Deflection
To view deflection data:
- Click on the Loads Analysis Results tab
- Click on the Deflection tab
The Deflection tab contains a table with deflection information at points of interest along the beam. For the deflection output, the interval of the points of interest is fixed to 50 mm. A sample loads analysis results table for deflection is shown in Figure 3‑74.
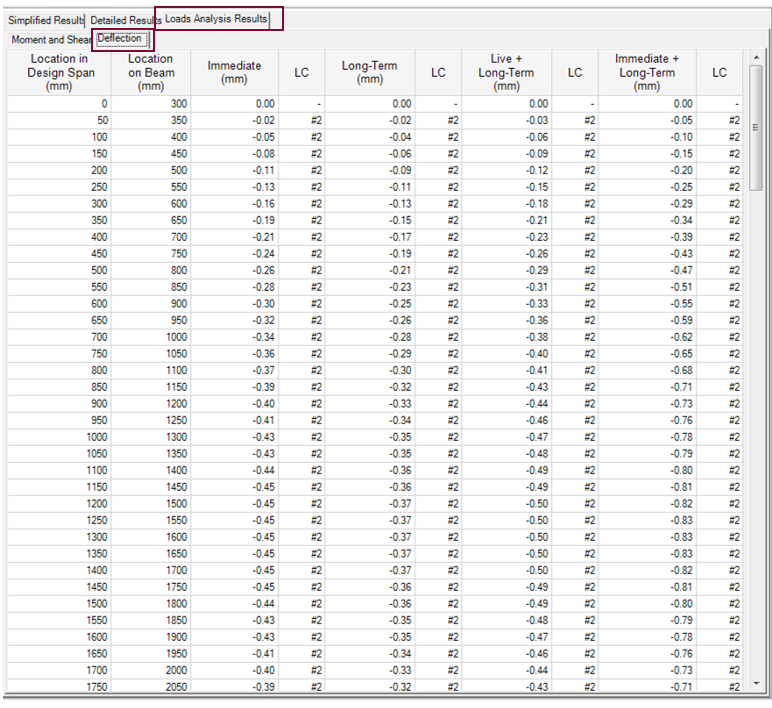
Figure 3‑74: Loads Analysis Results (Deflection)
The first and second columns of the table indicate the location of the points of interest on the beam, from left to right; the first column shows the location with respect to the design length (distance between supports), and the second column the location with respect to the beam length (starting from the beginning of the left overhang).
The following columns indicate the deflection at the points of interest. When the critical load envelope is selected, from the Critical Load Envelope drop-down box, the value displayed is the largest of deflection values for all load combinations; and, the ‘LC’ column shows the number of the load combination where that deflection value came from. If a particular load combination is selected (i.e.: LC#2: 1.25D + 1.5L), the columns show the deflection values at the points of interest for that particular load combination; and, the ‘LC’ column shows the number of the load combination selected.
The ‘Immediate’ column shows the values of immediate elastic deflection caused by all the applied loads on the beam.
The ‘Long-Term’ column shows the values of long term deflection obtained by multiplying the sustained deflection by a time dependent factor (CSA S304-14: 11.4.4). For the calculation of the time dependent factor, the program assumes all sustained loads are applied for a period of time greater than 5 years (St=1.0). The sustained deflection is the immediate deflection caused by all sustained loads (i.e.: dead 100% sustained, live 50% sustained, snow 60% sustained, earthquake 20% sustained, wind 50% sustained, etc).
The ‘Live + Long-Term’ column shows the values of live load deflection plus the long term deflection. In MASS™ the live load deflection is caused by the following loads: live, snow, wind, earthquake, storage, solid, and controlled fluids.
The ‘Immediate + Long-Term’ column shows the values of the immediate deflection plus the long term deflection.
Continue Reading: Beam Design Strategy